
More Information
Submitted: March 23, 2021 | Approved: April 06, 2021 | Published: April 07, 2021
How to cite this article: Ibrahim AE, Elhenawee M, Saleh H, Sebaiy MM. Overview on liquid chromatography and its greener chemistry application. Ann Adv Chem. 2021; 5: 004-012.
DOI: 10.29328/journal.aac.1001023
ORCiD: orcid.org/0000-0002-5949-2834
Copyright License: © 2021 Ibrahim AE, et al. This is an open access article distributed under the Creative Commons Attribution License, which permits unrestricted use, distribution, and reproduction in any medium, provided the original work is properly cited.
Keywords: HPLC; UHPLC; Monolithic columns; Green chemistry; Green chromatography

Overview on liquid chromatography and its greener chemistry application
Adel E Ibrahim1, Magda Elhenawee2, Hanaa Saleh2 and Mahmoud M Sebaiy3*
1Department of Pharmaceutical Analytical Chem, Faculty of Pharmacy, Port Said University, Port Said, 42511, Egypt
2Department of Analytical Chem, Faculty of Pharmacy, Zagazig University, Zagazig, Egypt
3Department of Medicinal Chemistry, Faculty of Pharmacy, Zagazig University, Zagazig, 44519, Egypt
*Address for Correspondence: Mahmoud M Sebaiy, Department of Medicinal Chemistry, Faculty of Pharmacy, Zagazig University, Zagazig, 44519, Egypt, Tеl: 01062780060; Fаx: 0552303266; Email: mmsebaiу@zu.edu.eg; sebaiу[email protected]
This literature review is concerning with liquid chromatography specifically high performance liquid chromatography (HPLC), Ultra high performance liquid chromatography (UHPLC), chromatography theory, chromatographic parameters, monolithic columns, principles of green chemistry and its application ingreen chromatography.
High performance liquid chromatography (HPLC)
HPLC is a separation technique where analytes in a multi-component mixture are separated due to the difference in their affinities between liquid mobile phase and solid stationary phase [1]. In HPLC, the liquid mobile phase is forced by pump system through the pores of the stationary phase into a reusable column. The first separation in chromatography was attained by the Russian botanist, Mikhail Tswett, who separated plant pigments using calcium carbonate fine particles column. A.J.P. Martin & R.L.M. Synge won noble prize in 1952 for their contributions in the field of chromatographic separation. Since then and due to the magical separation power and wide applications of liquid chromatography, it became the most practiced and evolved means of analytical separation. HPLC consists of a pump that forces the liquid mobile phase under high pressure through column containing stationary phase. Samples are injected at the inlet of the column then the eluents are detected and using different types of detectors and chromatogram is produced. For multiple accurate sample loading (n = 100 or more), the apparatus of autosampler is required for high throughput HPLC. Along the years, lots of improvements have been done to overcome the different disadvantages that face the use of HPLC. Among these drawbacks are the low resolution power, long separation time, high back pressure and the large volume consumption of mobile phase. Being the heart and the main core for separation, column and column packing materials were the main focus for such improvements.
Factors affecting HPLC separation: In order to understand how developments in HPLC were achieved, we have to understand first the factors that affect separation. Table 1 describes the relation between independent parameters of column length, particles size, column temperature and mobile phase flow rate with the dependent parameters of analysis time, column back pressure and column efficiency.
Increasing column length will increase efficiency of separation, but will also increase column back pressure and analysis time. While the decrease in size of packed particles will enhance efficiency, but will highly increase column back pressure. On the other hand, as flow rate increases, analysis time will decrease giving faster separation. The increase in flow rate is counteracted by the increase in developed column backpressure. The efficiency of separation on changing the flow rate is governed by Van Deemter equation which will be discussed later in this review. Column temperature has two effects. First, increasing temperature will decrease viscosity of mobile phase and hence decreasing column backpressure and giving chance to increase flow rate. Second, as temperature increases, analytes mass transfer will be enhanced and thus efficiency at higher flow rates. However, increasing temperature is limited by the use of thermally stable analytes and the boiling point of the mobile phase used.
Fundamental theory of liquid chromatography (Plate theory): The elution order of solutes through a chromatographic system is according to increasing their distribution coefficient with respect to the stationary phase. To understand the retention behavior of solutes and column efficiency for separation, plate theory describes this [2]. The theory assumes that the solute, during its passage through the column, is always in equilibrium between the mobile and stationary phases. But actually the solute is continuously passing from one phase to another, so this equilibrium never actually occurs. To establish such equilibrium with the two phases, the column is supposed to be divided into a number of cells or theoretical plates. Each cell possesses a specific size that provides the solute with adequate time to establish equilibrium with the two phases. So, decreasing this plate height or cell size will allow faster achievement of equilibrium. For this reason, column efficiency is related to theoretical plates number (N).
HPLC chromatographic parameters: Figure 1 shows simple illustration of a chromatogram and parameters that are obtained from it.
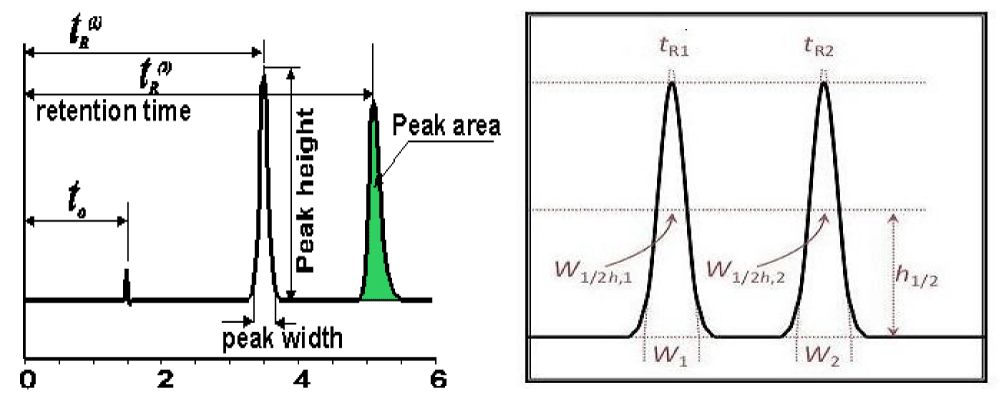
Figure 1: Chromatogram showing different chromatographic parameters.
Retention factor (K): Eluted solute can be identified by its retention factor as explained by equation (eq.1), where tR is the analyte’s retention time and t0 is the retention time of non-retentive solute that spends all its time in the mobile phase.
K = (tR – t0)/ t0 (1)
Selectivity (a): It’s also known as the relative retention and is determined by the retention factor for two solutes (k2 and k1). Selectivity is a value larger than 1 (eq. 2)
a = k2 / k1 (2)
Resolution (Rs): Resolution is the parameter that describes the power of chromatographic system to separate two solutes, 1 and 2, from a mixture (eq. 3). W is the mean peak width for each solute.
Rs = 2* (tr2 – tr1)/ (w1 – w2) (3)
Linear velocity (u): On setting up a chromatographic condition, flow rate (F) is chosen. Linear velocity is a measured by dividing column length (L) by the elution time of non-retentive solute (t0). (eq. 4).
u = L / t0 (4)
The relationship between flow rate and linear velocity is represented by eq. 5
u = F / εt*π*r2 (5)
Where εt is total column porosity, r is the column diameter.
Number of theoretical plates (N): As mentioned before, N is an important expression of column efficiency. N can be calculated from the analyte’s peak width at half height (W0.5) for certain solute’s retention time (tr) (eq. 6).
N = 5.54 (tr /W0.5)2 (6)
Plate height (H): is the length of each theoretical plate or band corresponding to each cell size in column plate theory (eq. 7)
H = L / N (7)
Rate theory and Van Deemter plot: Over the last two decades, major changes in the field of analytical chromatography occurred and have been responsible for a leap in separation performance. The performance of the chromatographic column is the key element in the separation process. Development of rate theory made by Van Deemter [3], gave rise to Van Deemter plots which are commonly used to describe column performance through plotting the height equivalent to theoretical plate (H or HETP) against the average linear velocity (u). Van Deemter equation form seen below (eq. 8) describes this relation.
H = (A + B)/(u + Cu) (8)
Where A, B and C are coefficients.
A-term is known as Eddy diffusion term and is a measure of packing efficiency and is a function of particle size and packing efficiency. Molecules traveling along the column follow different paths depending on the geometry and particle size of the packing materials and these different paths are responsible for peak broadening. The differential path lengths will be more in a poorly packed bed. Tight particle size distribution improves the A-term.
B-term is a function of longitudinal diffusion which represents the contribution to band broadening caused by mobile phase axial diffusion in the column. The term is inversely proportional to the mobile phase velocity. So this effect will be evident on low flow rates causing longer residence times in column and as we increase flow rate, this effect will be minimal at and after optimal flow rate.
The C-term is a function of mass transfer between the stationary phase and mobile phase as well as within the mobile phase. Partition equilibrium will be established since some analyte molecules will return to mobile phase and some molecules move to stationary phase which hence provides continuous mass transfer between the moving mobile phase and the stationary phase stagnant particles. The C-term has more effect on large molecules than on small molecules.
Figure 2 shows a diagram describing the sum of the three terms. As noted, B-term will be the dominating one at lower flow rates while C-term dominates in higher flow rates. The minimum of the curve represents the ideal flow velocity at which maximum column efficiency is attained where the H is lowest.
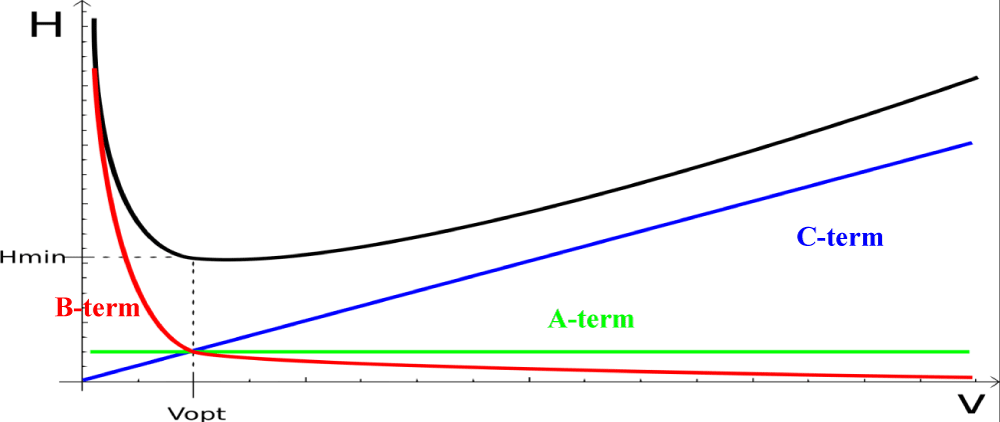
Figure 2: Van Deemter three terms. (V is linear velocity, Vopt is optimum velocity for better performance).
From the figure shown, we can see that:
• The A term is independent of linear velocity and does not contribute to the value of H.
• The contribution of the B-term is negligible at normal operating conditions since the molecular diffusion is very small in liquid.
• The C-term increases linearly with mobile phase linear velocity and contribute significantly to the shape of the curve. A small C-term leads to a flat ascending portion of the curve at high mobile phase velocities. This means that separations can be carried out at higher mobile phase velocities without sacrificing the resolution.
Fast liquid chromatography
Nowadays, time is of an ultimate importance in all fields of academic research and industry especially the pharmaceutical industry where high throughput is demanded in research and development as well as in quality control. That’s why much method developments are being directed towards reduction of analysis time. Since HPLC became the method of choice for many applications in science and industry, faster analysis time became a driving force and motivation for scientists to decrease time lost in the large number of analyses done daily and also to decrease the economic loss of valuable reagents in analysis.
The term “fast HPLC”, itself, is a relative term. There’s no clear definition of fast HPLC as it’s a poor measure for chromatographic performance rather than the more important parameter of number of analytes separated per unit time. For instance, ten analytes separated in a ten minutes run is more efficient than two analytes separated in the same ten minutes run.
Old trends for fast HPLC: The first trends towards faster analysis depended on affecting the main parameters affecting HPLC separation (revise Table 1).
| Table 1: Factors affecting separation in HPLC. | ||||
| Parameter | Column length(L) | Flow rate(F) | Particle size(dp) | Temperature(T) |
| Analysis time | a L | a 1/F | No relation | a 1/Tx |
| Backpressure | a L | a F | a 1/dp2 | a 1/T |
| Efficiency | a L | Van Deemter | a 1/dp | a T |
The use of short columns reduces time of analysis. However it will affect resolution as it decrease number of theoretical plates.
Increasing flow rate is another way to reduce run time, but is still hindered by two facts. The first is the optimum flow rate that corresponds to the highest column efficiency according to Van Deemter. The second is the increase in backpressure proportionally to increasing the flow rate.
• The use of smaller particle sizes sure will enhance efficiency of analysis and hence speed up the analysis time. However this is challenged by the two folds increase in back pressure and even the columns may be more likely blocked.
• Increasing temperature will decrease band spacing and so increase the resolution between adjacent peaks. Also increasing temperature will enhance the analyte’s mass transfer so increase column efficiency. Finally, the decrease in viscosity of mobile phase caused by temperature increase gives a chance for use of faster flow rates. However, this is still restricted by the thermal stability of the analytes under test and by the boiling point of the mobile phase.
Therefore the use of old traditional approaches to produce fast HPLC is inherently restricted by column back pressure.
New trends for fast HPLC: The history of column packing starts in the early years of HPLC when routine HPLC separation extended to several hours [4]. For more than 25 years (1950s and earlier), chromatographers used large porous particles of silica and alumina (more than 100 m) in open glass columns and mobile phase was driven by gravity. The columns were packed with irregularly shaped non-porous particles. Then in 1967, spherical glass beads were first introduced as regularly shaped packing materials.
The early 1970s witnessed the emergence of HPLC which used high pressure pumps to force the mobile phase through the column and subsequently development of packed columns focused on decreasing particles size [4] (Figure 3).
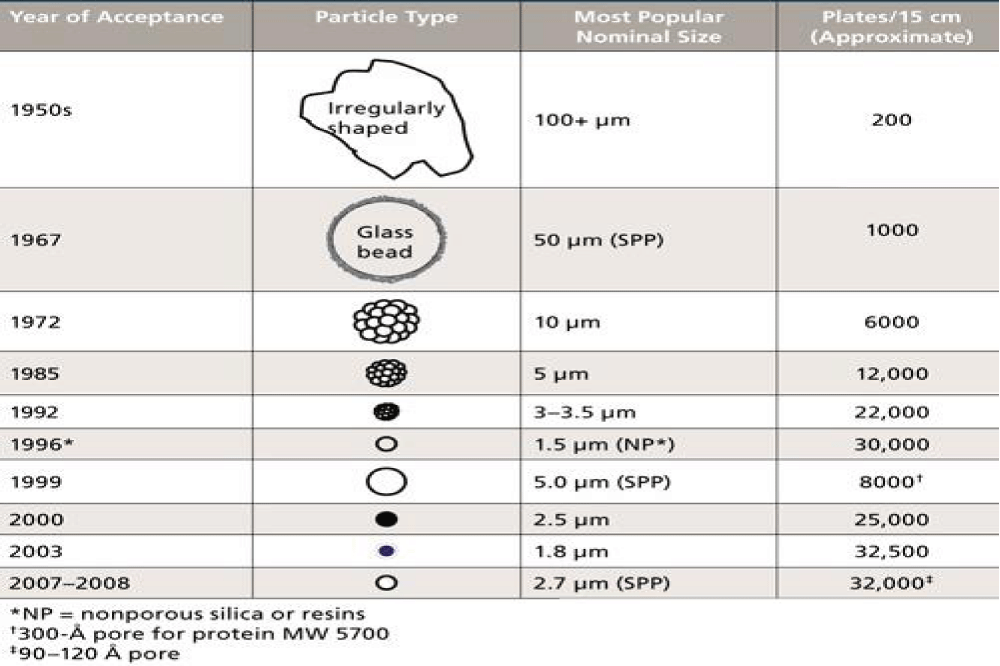
Figure 3: The history of packed columns.
However, the use of small sub-2 μm particles requires ultra-high pressure pumps used in ultra-high performance liquid chromatography (UHPLC) which can force pressure up to 1400 bar.
Recently, the main approach followed as a way for fast HPLC is changing the morphology of the packing materials used in separation columns. This led to the emergence of superficially porous silica particles introduced by Kirkland and co-workers [5-7] and monolithic silica columns introduced by Minakuchi and Soga [8].
Particulate fused core columns: Fused core particles are also known as superficially porous particles (SPP) and core shell particles because it consists of solid core surrounded by thin porous shell. Figure 4 [9] shows the fundamental difference between superficially porous particles and the traditional totally porous particles.
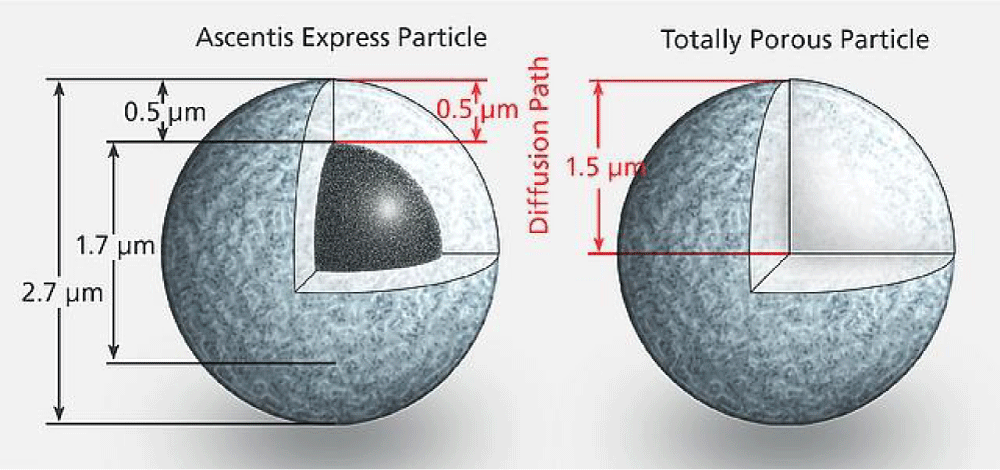
Figure 4: Structure of superficially porous particles (left) and totally porous particles (right).
In 1967, Horvath and lipsky, [10] introduced for the first time very large 50μm glass beads core surrounded by thin layer of anion exchange resin. These were described by Horvath by the term (pellicular particles). Later, Horvath and Lipsky, discussed pellicular particles theoretically and practically [11]. Practically, pellicular particles were of limited use because of their low surface areas available for sample interaction.
Fused core particles were developed first by Kirkland, [7]. The thin shell of developed 5 mm SPP minimizes the diffusion distances of high molecular weight molecules that are slowly diffusing because they must travel inside the particles during the chromatographic separation. The improvements in mass transfer of such molecules as well as the smaller particle size of SPP give chance for fast separation and allowing higher mobile phase velocities. Moreover, the shorter diffusion path reduces axial dispersion of solutes and hence minimizes band broadening and gives better resolution (Figure 5).
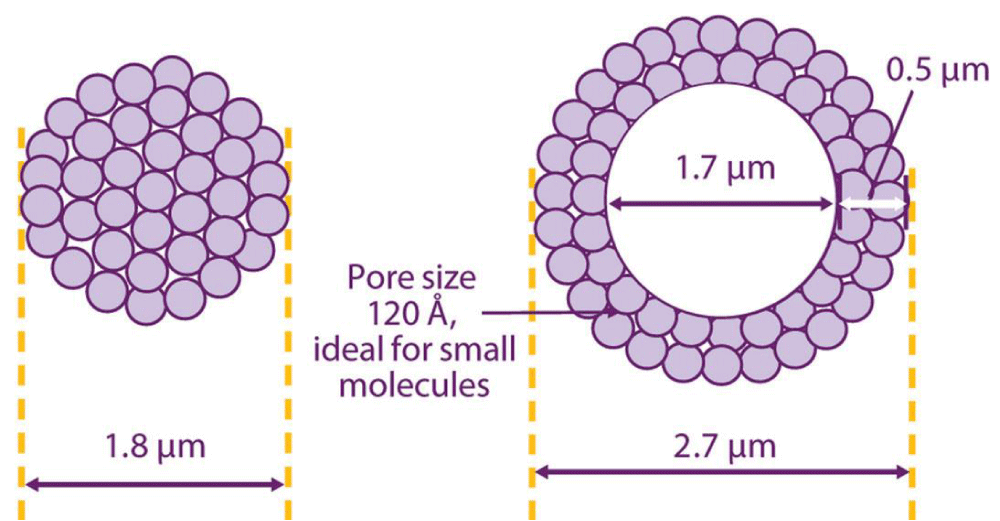
Figure 5: Diffusion path within totally porous particles (left) and superficially porous particles (right).
SPP were first introduced as a substitute for sub-2 mm particles which though having high efficiency in chromatographic separation, required special instrumentation to overcome the high back pressure developed. According to Destefano [12], SPP have 50% to 75% of surface area compared to totally porous particles, resulting in smaller capacity factor (K). This does not represent a practical problem since a small decrease in organic modifier concentration for a reversed phase separation can restore longer retention time. So SPP in the size range of 2.5-2.7 mm will show equivalent efficiencies to those totally porous sub-2 mm particles, but at one-half their exerted back pressure.
Monolithic silica columns: Despite the numerous successes achieved in the problems of mass transfer within packed particulate columns, the need for new separation media formats to keep up with the demands for faster and highly efficient chromatography pushed scientists in the way of development of new stationary phases. The concept of monolith in the field of liquid chromatography itself is old and returns to 1950s [13], but it didn’t gain popularity until the 1990s on hands of pioneer researchers in this field [8,14-16].
Basically, monolithic silica gel is prepared by gel-sol approach alkoxysilanes as silica source and polyethylene oxide in acidic aqueous solution. Hydrolysis and polycondensation accompanied by phase separation give rise to formation of three dimensional continuous silica gel skeletons. Many literatures described such syntheses [17-19]. Then by sealing a monolithic silica rod with a poly ether ketone (PEEK) tube, the material can be used as a HPLC column (Figure 6) [20].
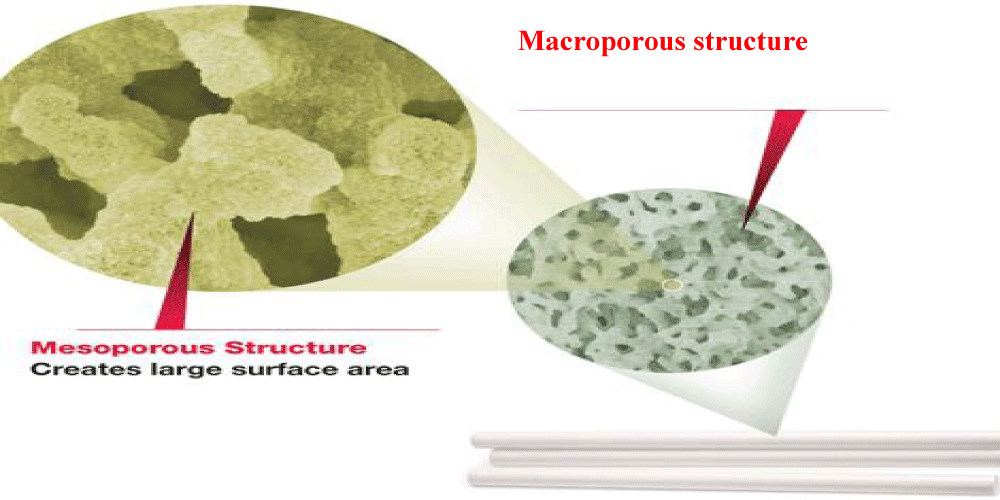
Figure 6: Structure of monolithic stationary phase.
This silica skeleton has a bimodal porosity, macropores (about 2 mm size) and mesopores (nanometer size). The domain size and total porosity can be controlled during synthesis. The large macropores are responsible for the low resistance against mobile phase flow, while the mesopores are responsible for the large surface area ensuring high separation efficiency. Even after octadecylsilylation, monolithic columns have higher porosity than conventional particulate columns 80% vs. 65% [17].
The first generation conventional monolithic silica column with inner diameter 4.6 mm has been commercialized from Merck® (Darmstadt, Germany) since 2000 [21]. In 2011, the next generation of monolithic columns, Chromolith®, was introduced by Merck in the market which is different from the classic monolith in smaller macropores size (1.15 mm) and smaller mesopores size (15 nm) which ensures large surface area (250 m2/gm) providing separation efficiency (up to 200000 N) [22].The macroporous structure of monolithic columns allows rapid mobile phase flow at low back pressure than the conventional particulate packed columns (Figure 7) [23]. This gives a chance for higher flow rates, up to 9 mL/min, and hence faster analysis.
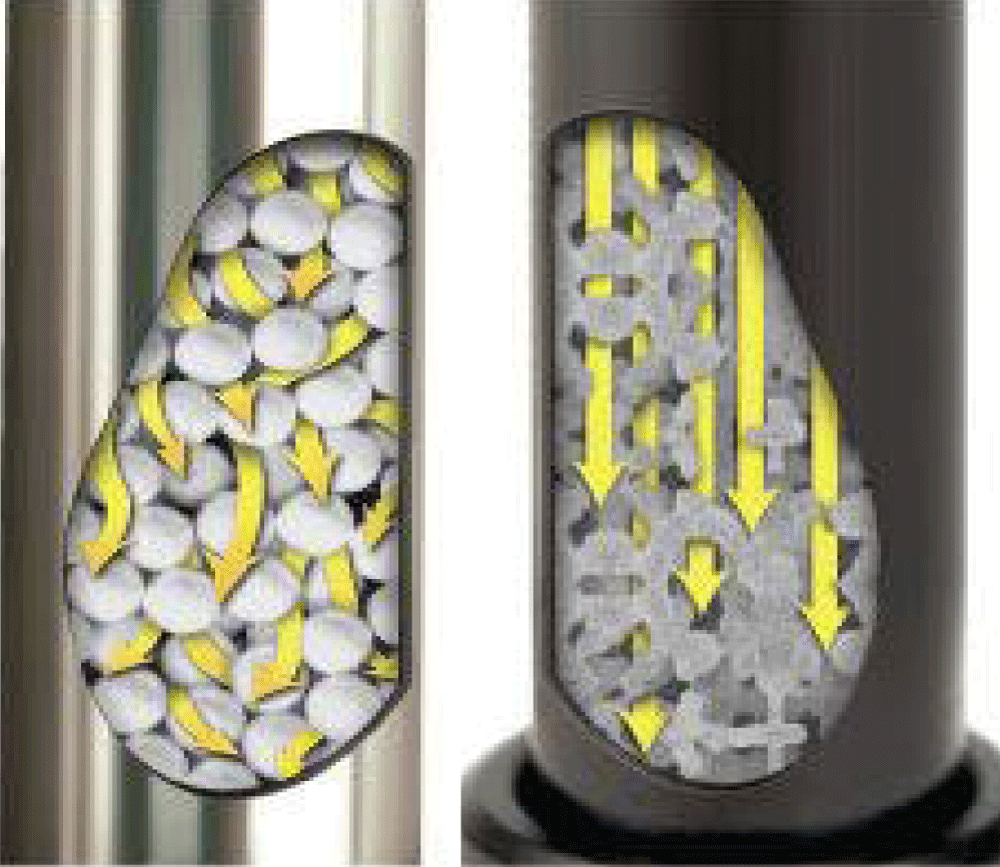
Figure 7: Mobile phase flow through particulate packed column (left) and monolithic column (right).
Few important facts should be noticed concerning the use of monolithic columns:
• The first is that the density of monolithic columns is much lower than particulate ones. This makes the load ability of conventional column of the same size much higher. Table 2 summarizes the main parameters for monolithic column [24].
| Table 2: Specification for Chromolith® column. | |
| Silica type | 99.9% high purity |
| Particle size | Monolithic |
| Macropore size | 2 mm |
| Mesopore size | 13 nm |
| Surface area | 300 m2/gm |
| Total porosity | More than 80% |
| pH range | 2.0 – 7.5 |
| Column cladding material | PEEK |
| Surface modification | RP-C18 end-capped |
• Up till now, stationary phases available as monolithic rods are limited to normal silica, C8 and C18- bonded phases.
• It’s difficult to prepare straight rods of monolith longer than 15 cm due to the significant shrinkage occurring during the formation of the skeleton. However, this can be overcome by coupling several columns in a series.
Ultra high performance liquid chromatography (UHPLC)
The need for speed; this term is wide spread and known in the field of chromatography. The benefits gained from faster analysis are clear; they allow larger number of analyses done in short time and hence increase productivity of the testing laboratory. Improvements had been made to HPLC in order to enhance resolution efficiency, analysis time and solvent consumption. The use of shorter columns and/or higher flow rates has been used. Elevated temperature has dual advantage, first it enhance solute mass transfer by increasing analytes’ diffusivity. Secondly, it lowers mobile phase viscosity allowing also higher flow rates [25]. However, changing the previous parameters on the conventional particle sizes requires compromises to be done which may result in trading resolution for time [26].
Another important fact to be taken in consideration is the frictional heating. Forcing liquid through columns packed with small particles could generate heat. With large column diameters used in HPLC (3.0 to 4.6 mm), frictional heating can cause loss of performance as a result of temperature induced non uniform flow [27]. To diminish the effect of frictional heating, smaller diameter columns (1-2.1 mm) should be used [28] which will in turn increase column backpressure.
The best and most straightforward way to improve HPLC separation is by reducing the particle size of the column packing material [29]. However, decreasing both the particle size and column diameter will produce higher column backpressure that exceeds the maximum operating pressure for HPLC pumps (Nearly 400 bar). This will require special instrumentation found only in the modern techniques of UHPLC.
UHPLC history and instrumentation: In 1996, non-porous particles of diameter 1.5 µm were designed for fast separation of bio-molecules and showed excellent efficiencies. However, these sub-2 µm particles produced high column backpressure that exceeded the existing pump systems capacity. Also, they were of short life due to fast plugging. It wasn’t until 2003 when Agilent technologies introduced the first 1.8 µm particles column which was an evolution in column technology [4].
The first commercially available UHPLC system was introduced by Waters in 2004 and was called Waters Acquity UPLC® system with pumping system that could withstand up to 19000psi [30].
Conventional HPLC instrumentation was of no use in the new UPLC systems. So, the following new instrumentation technologies were added:
A. Sample injection; Sample injection is very critical step in UPLC as the conventional injection valves were not designed to withstand the high pressure. Additionally, the injection process must be fast (1-3 seconds long) and pulse free to prevent pressure fluctuations on the column and maintain UHPLC speed [30].
B. UHPLC columns; in 2000, the first generation hybrid chemistry evolved that was followed by second generation bridged ethane hybrid (BEH) technology. These technologies aimed for providing higher mechanical strength for UHPLC columns by bridging methyl groups in the silica matrix [31].
C. Detectors; UV-detectors used in UHPLC analyses required a reduced flow cell volume to maintain the concentration and hence enhance signal strength.
Advantages of UHPLC: UPLC advantages are clearly obvious. UHPLC presents a new chemistry and instrument technology using the same chromatographic principles as HPLC, but with the ability to fulfill a promising development in the following aspects:
A. The main advantage is the reduction of analysis time
B. Lower solvent consumption
C. More information is provided per unit work and hence the productivity of research laboratories increases.
D. Decrease the overall cost of analysis.
E. Sensitivity is improved leading to quantification of minute amounts of solutes.
F. Separation efficiency and resolution between peaks are enhanced and hence it’s more suitable for complex analytical determinations.
Disadvantages of UHPLC: Although analysis time is shorter and the sample throughput increased upon using UHPLC, some drawbacks face UHPLC utilization, which are:
A. One of the main disadvantages of UHPLC is the low peak area repeatability values in UHPLC analyses. This may be attributed to the small injection volumes and also to the very high difficulty in packing of the tiny sub-2 mm particles which makes columns of the same type vary to a considerable deal.
B. Another main disadvantage of UHPLC is the very high working backpressure developed during analyses. This high backpressure results in shorter column lifetime as well as requiring more maintenance to the UHPLC instrument.
C. Being the most recent chromatographic technique, it would probably take some time with lots of practical experiments for method transfer from HPLC to UHPLC.
Green chemistry
In the last two decades, green chemistry has gained a great momentum in many fields of chemistry. The concept of green chemistry started in the sole purpose of decreasing pollution produced from industry. In 1991, P. A. Anastas, was the first to use this term in the United States as a research program launched by US Environmental Protection Agency (EPA). Afterwards, twelve principles were introduced by Anastas and Warner, [32], those principles became the base of green chemistry.
The twelve principles of green chemistry:
1. Preventing waste is better than cleaning it.
2. It’s better to design synthetic methods that can incorporate all the starting material to give the final product.
3. It’s better to use low toxicity substances.
4. Production of chemicals should take into consideration their toxicity.
5. Whenever possible, avoid the use of auxillary substances.
6. Minimize the energy required for chemical processes.
7. It’s preferable to use renewable instead of depleting raw materials.
8. Avoid derivatization when possible.
9. Use selective catalysts.
10. Design chemical products that don’t persist in the environment after degradation.
11. Developed methodologies should monitor in process the formation of any hazardous products.
12. Use safer chemistry that minimizes the possibility of chemical accidents.
Green chromatography: Analytical Chem has two-fold relationship with green chemistry. On one hand, Analytical Chem measures the greenness of chemical technology or product and the degree of its hazard to the environment. On the other hand, Analytical Chem is targeted by green chemistry as many principles apply to it (e.g. using hazardous solvents and amount of organic waste). Development of new analytical methodologies is an important step in the direction of going greener in chemistry [33].Regarding the green chemistry, as HPLC usually performs molecular reaction or separation. In columns, the usage of glass and plastic tube materials could be reduced compared to ordinary bio-chemical reactions in vitro.
Two main goals exist for greener chromatography; the first goal is using safer mobile phase. The second goal is decreasing the consumption of organic solvents and hence decreasing the waste [34].
Minimize organic waste production: This goal can be attained by several strategies of which we can numerate the following:
Selecting reversed phase chromatography instead of choosing normal phase chromatography which uses a lot of organic solvent. The hydrophobic character of C4 and C8 bonded phases are much lower than those for C18 bonded phase, and hence requires lower organic solvent strength to elute analytes. So, to decrease solvent consumption, C8 or C4 should be used instead of C18- bonded phase.
Fast liquid chromatography analysis using shorter columns and smaller diameter columns with higher efficiencies.
Isocratic elution is generally greener than gradient elution since it doesn’t require extra amount of the mobile phase for reconditioning before another injection takes place. However; the choice of elution technique still requires to compromise between run time and total number of analytes eluted. In some cases, gradient elution can be suitable for larger number of analytes in shorter analysis time than isocratic one.
Since reversed phase HPLC is the best choice when going greener [34], so the new silica substrates introduced in the last few years such as monolithic silica, superficial porous or fused-core silica based HPLC columns which have different characteristics than conventional porous silica columns have been studied widely.
Green mobile phase additives: On developing green chromatographic method, first choose green mobile phase constituents followed by optimizing the remaining parameters which comprises mainly the choice of stationary phase.
Additives are of common use in mobile phases. They have important role as buffering agents as well as having role in improvement of peak shape by ion pairing mechanism [35-37]. The physicochemical properties and solvation properties of ionic additives are dependent on both anionic and cationic parts.
Example of green additives is replacing trifluoro-acetic acid (TFA), which is corrosive, cytotoxic and environmentally persistent, by formic acid which decomposes easily to CO2 and H2O as well as having lower toxicity. Acetic acid is also safe substitute for TFA. Ammonium acetate and ammonium formate are safe salts for buffer preparation.
Changing mobile phase additives by biodegradable micellar mobile phase substances is another mean for greener chemistry [38]. Micellar liquid chromatography (MLC) is a mobile phase for reversed phase liquid chromatography which uses surfactant (e.g. sodium dodecyl sulfate) above its critical micelle concentration [39-41].
Cyclodextrin modifier as mobile phase additive helps to reduce proportion of organic phase as well as serving as biodegradable mobile phase substance [42].
Green organic solvents: The type of solvents used in chromatography is of equal importance as the amount used when we deal with greener chemistry. However, the solvent choice for HPLC use is not always simple. Three general areas have to be taken in consideration. One is worker safety including carcinogenicity and toxicity, then process safety including flammability and other potential emissions due to high vapor pressure and the last is the regulatory and environmental considerations including eco-toxicity and ground water contamination [43].
In 2008, de la Guardia, et al. presented a review that focused on decreasing solvent consumption and replacement of toxic reagents towards greener chemistry [44].
In general, hydrophilic (water miscible) solvents are better than hydrophobic solvents since they have lower volatility and toxicity. Table 3 shows Pfizer assessment list of solvents [43], that are commonly used by chemists, categorized as preferred, usable and undesirable categories [45].
| Table 3: Pfizer green solvent selection guide for medicinal chemistry. | ||
| Preferred | Usable | Undesirable |
| Water | Cyclohexane | Pentane |
| Acetone | Heptane | Hexane |
| Ethanol | Toluene | Di-isopropyl ether |
| 2-Propanol | Methylcyclohexane | Diethyl ether |
| 1-Propanol | Methyl-t-butyl ether | Dichloromethane |
| Ethyl acetate | Isoctane | Chloroform |
| Isopropyl acetate | Acetonitrile | Dimethyl formamide |
| Methanol | 2-MethylTHF | Pyridine |
| Methyl Ethyl ketone | Tetrahydrofuran | Dimethyl acetate |
| 1-Butanol | Xylenes | Dioxane |
| t-Butanol | Dimethylsulfoxide | Dimethoxyethane |
| Acetic acid | Benzene | |
| Ethylene glycol | Carbon tetrachloride | |
All undesirable solvents should be avoided, while those that are still usable can be better replaced by any of the preferred solvents category.
The most used solvent in chromatography is acetonitrile (ACN) due to its reputed unique characteristics such as high dissolving power, low acidity, minimal chemical reactivity, low UV cut-off and mass spectrum compatibility. However, literature reports that ACN incineration produce (NO2) gas, which is responsible for acid rains. Also synthesis of ACN requires more energy than other solvents production (e.g. Ethanol) [45].
Acetone use is limited as a mobile phase since it has high background absorbance under 330 nm so the baseline of the chromatogram is not easily controlled. Methanol is the cheapest hydrophilic solvent. However, replacing ACN by methanol in practice is not straightforward as selectivity changes will occur, which hinders a more general use of methanol.
Ethanol has been used intensively in the early days of LC. The problem is its high backpressure when compared with water-ACN or water-methanol mobile phases. But with advent of new high pressure instrumentation and new column packing materials, it’s now easier to use the green, biodegradable and cheap solvent ethanol. Its characteristic of low volatility, even, renders the mobile phase composition more stable upon longer storage.
In this review article, the authors tried to focus on techniques for greener chromatography such asusing greener mobile phase additives and organic modifiers in separations instead of the more toxic ones.
This literature review shed the light on the most common types of liquid chromatography mainly HPLC and UHPLC in addition to chromatography theory, chromatographic parameters, monolithic porous columns, green chemistry and its application ingreen chromatography.
- Snyder LR, Kirkland JJ, Dolan JW. Introduction to modern liquid chromatography. 2011: John Wiley & Sons.
- Cazes J, Scott RP. Chromatography theory. CRC Press. 2002; 88.
- Van Deemter JJ, Zuiderweg F, Klinkenberg AV. Longitudinal diffusion and resistance to mass transfer as causes of nonideality in chromatography. Chem Engi Sci. 1956; 5: 271-289.
- Majors RE. Historical developments in HPLC and UHPLC column technology: the past 25 years. 2015.
- Kirkland J, Truszkowski F, Ricker R. Atypical silica-based column packings for high-performance liquid chromatography. J Chromatogr A. 2002; 965: 25-34. PubMed: https://pubmed.ncbi.nlm.nih.gov/12236530/
- Kirkland J, Truszkowski F, Dilks Jr C, Engel G. Superficially porous silica microspheres for fast high-performance liquid chromatography of macromolecules. J Chromatogr A. 2000; 890: 3-13. PubMed: https://pubmed.ncbi.nlm.nih.gov/10976789/
- Kirkland J. Superficially porous silica microspheres for the fast high-performance liquid chromatography of macromolecules. Analytical Chem. 1992; 64: 1239-1245.
- Nakanishi K, Soga N. Phase separation in gelling silica–organic polymer solution: systems containing poly (sodium styrenesulfonate). J Am Ceramic Soc. 1991; 74: 2518-2530.
- website SA. https://www.sigmaaldrich.com/analytical-chromatography/analytical-products
- Horvath CG, Preiss B, Lipsky SR. Fast liquid chromatography. Investigation of operating parameters and the separation of nucleotides on pellicular ion exchangers. Analytical Chem. 1967; 39: 1422-1428. PubMed: https://pubmed.ncbi.nlm.nih.gov/6073805/
- Horvath C, Lipsky S. Column design in high pressure liquid chromatography. J Chromatogrp Sci. 1969; 7: 109-116.
- De Stefano JJ, Schuster SA, Lawhorn JM, Kirkland JJ. Performance characteristics of new superficially porous particles. J Chromatogr A. 2012; 1258: 76-83. PubMed: https://pubmed.ncbi.nlm.nih.gov/22939204/
- Mould D, Synge R. Electrokinetic ultrafiltration analysis of polysaccharides. A new approach to the chromatography of large molecules. Analyst. 1952; 77: 964-969.
- Svec F, Fréchet JM. Continuous rods of macroporous polymer as high-performance liquid chromatography separation media. Analytical Chem. 1992; 64: 820-822.
- Tennikova T, Svec F, Belenkii B. High-performance membrane chromatography. A novel method of protein separation. J Liquid Chromatogr. 1990; 13: 63-70.
- Minakuchi H, Nakanishi K, Soga N, Ishizuka N, Tanaka N. Octadecylsilylated porous silica rods as separation media for reversed-phase liquid chromatography. Analytical Chem. 1996; 68: 3498-3501. PubMed: https://pubmed.ncbi.nlm.nih.gov/21619283/
- Minakuchi H, Nakanishi K, Soga N, Ishizuka N, Tanaka N. Effect of skeleton size on the performance of octadecylsilylated continuous porous silica columns in reversed-phase liquid chromatography. J Chromatogr A. 1997; 762: 135-146. PubMed: https://pubmed.ncbi.nlm.nih.gov/9098972/
- Nakanishi K, Shikata H, Ishizuka N, Koheiya N, Soga N. Tailoring mesopores in monolithic macroporous silica for HPLC. J Separat Sci. 2000; 23: 106-110.
- Hara T, Kobayashi H, Ikegami T, Nakanishi K, Tanaka N. Performance of monolithic silica capillary columns with increased phase ratios and small-sized domains. Analytical Chem. 2006; 78: 7632-7642. PubMed: https://pubmed.ncbi.nlm.nih.gov/17105153/
- Tzanavaras PD. Automated Quality Control of Pharmaceuticals using Sequential Injection Chromatography (SIC). Pharmaceut Anal Acta. 2012; 3: e130.
- Homepage M. http:// www.merckmillipore.com
- Kučerová B, Krčmová L, Solichová D, Plíšek J, Solich P. Comparison of a new high‐resolution monolithic column with core‐shell and fully porous columns for the analysis of retinol and α‐tocopherol in human serum and breast milk by ultra‐high‐performance liquid chromatography. J Separat Sci. 2013; 36: 2223-2230.
- website P. https://www.phenomenex.com
- website M. http://www.merck.de/servlet/PB/menu/1209750/index.html
- Neue UD, Mazzeo JR. A theoretical study of the optimization of gradients at elevated temperature. J Separat Sci. 2001; 24; 921-929.
- Giddings JC. Unified separation science. 1991: Wiley New York etc.
- Halász I, Endele R, Asshauer J. Ultimate limits in high-pressure liquid chromatography. J Chromatogr A. 1975; 112: 37-60.
- Colón LA, Cintrón JM, Anspach JA, Fermier AM, Swinney KA. Very high pressure HPLC with 1 mm id columns. Analyst. 2004; 129: 503-504. PubMed: https://pubmed.ncbi.nlm.nih.gov/15152325/
- Jerkovich AD, Mellors JS, Jorgenson JW, Majors RE. The use of micrometer-sized particles in ultrahigh pressure liquid chromatography. LC GC North America. 2003; 21: 600-611.
- Swartz ME. UPLC™: an introduction and review. J Liquid Chromatogra Related Technol. 2005; 28: 1253-1263.
- Taleuzzaman M, Ali S, Gilani SJ, Imam SS, Hafeez A. Ultra Performance Liquid chromatography (UPLC) - A review. Austin J Anal Pharm Chem. 2015; 2: 1056-1060.
- Anastas PT, Warner JC. Green chemistry: theory and practice. 2000: Oxford university press.
- Anastas PT. Green chemistry and the role of analytical methodology development. Critical reviews in Analytical Chem. 1999; 29: 167-175.
- Lu CY. Green Chromatography. Handbook of Green Analytical Chem. 2012; 175-198.
- Xiaohua X, Liang Z, Xia L, Shengxiang J. Ionic liquids as additives in high performance liquid chromatography: Analysis of amines and the interaction mechanism of ionic liquids. Analytica Chim Acta. 2004; 519: 207-211.
- Han D, Tian M, Park DW, Choi DK, Row KH. Application of ionic liquids as mobile phase additives and surface-bonded stationary phase in liquid chromatography. Korean J Chem Engi. 2009; 26: 1353-1358.
- Marszałł MP, Bączek T, Kaliszan R. Reduction of silanophilic interactions in liquid chromatography with the use of ionic liquids. Analytica Chim Acta. 2005; 547: 172-178.
- El-Shaheny RN, El-Maghrabey MH, Belal FF. Micellar liquid chromatography from green analysis perspective. Open Chemistry. 2015; 13; 877–892.
- Ruiz-Angel M, Carda-Broch S, Torres-Lapasió J R, García-Álvarez-Coque M. Retention mechanisms in micellar liquid chromatography. J Chromatogr A. 2009; 1216: 1798-1814. PubMed: https://pubmed.ncbi.nlm.nih.gov/18838142/
- Memon N, Bhanger MI, Khuhawer M. Determination of preservatives in cosmetics and food samples by micellar liquid chromatography. J Separat Sci. 2005; 28: 635-638. PubMed: https://pubmed.ncbi.nlm.nih.gov/15912732/
- Nishi H. Pharmaceutical applications of micelles in chromatography and electrophoresis. J Chromatogr A. 1997; 780: 243-264. PubMed: https://pubmed.ncbi.nlm.nih.gov/9335130/
- Youngvises N, Chaida T, Khonyoung S, Kuppithayanant N, Tiyapongpattana W, et al. Greener liquid chromatography using a guard column with micellar mobile phase for separation of some pharmaceuticals and determination ofparabens. Talanta. 2013; 106: 350-359. PubMed: https://pubmed.ncbi.nlm.nih.gov/23598137/
- Alfonsi K, Colberg J, Dunn PJ, Fevig T, Jennings S, et al. Green chemistry tools to influence a medicinal chemistry and research chemistry based organisation. Green Chemistry. 2008; 10: 31-36.
- Armenta S, Garrigues S, De la Guardia M. Green Analytical Chem. TrAC Trends in Analytical Chem. 2008; 27: 497-511.
- Sandra P, Vanhoenacker G, David F, Sandra K, Pereira A. Green chromatography (part 1): introduction and liquid chromatography. 2010.