
More Information
Submitted: September 24, 2021 | Approved: October 11, 2021 | Published: October 12, 2021
How to cite this article: Verushkin AG, Kulikov AY, Kutsanyan AA. A validated method for coumarin quantification in Meliloti herba and its ethanolic extracts using micellar thin-layer chromatography. Ann Adv Chem. 2021; 5: 013-018.
DOI: 10.29328/journal.aac.1001024
ORCiD: orcid.org/0000-0002-0200-5222
Copyright License: © 2021 Verushkin AG, et al. This is an open access article distributed under the Creative Commons Attribution License, which permits unrestricted use, distribution, and reproduction in any medium, provided the original work is properly cited.
Keywords: Coumarin; Micellar thin-layer chromatography; Meliloti herba; Validation

A validated method for coumarin quantification in Meliloti herba and its ethanolic extracts using micellar thin-layer chromatography
Aleksey G Verushkin1, Artem Yu Kulikov1* and Andranik A Kutsanyan2
1Laboratory of Pharmacopoeial Analysis, Ukrainian Scientific Pharmacopoeial Center for Quality of Medicines, 33 Astronomicheskaya str, Kharkiv, 61085, Ukraine
2Department of Chemistry of Natural Compounds and Nutriciology, National University of Pharmacy, 53 Pushkinska str, Kharkiv, 61022, Ukraine
*Address for Correspondence: Artem Kulikov, Laboratory of Pharmacopoeial Analysis, Ukrainian Scientific Pharmacopoeial Center for Quality of Medicines, 33 Astronomicheskaya str, Kharkiv, 61085, Ukraine, Email: [email protected]; [email protected]
A micellar thin-layer chromatography method for the quantitative determination and validation of coumarin in Meliloti herba and its ethanolic extracts was developed and validated. For achieving good determination, the mobile phase of 5x10⁻⁴ mol/L Tween-80 in a mixture propanol-2 – water (5:95 v/v) was used. Densitometric determination was carried out at 275 nm. The calibration curve was linear in the range of 0.1-2.5 μg per band. The proposed method is simple, rapid, precise and accurate; replacing hazardous solvents by greener ones correspond to the modern requirements in “Green chemistry” concepts. The obtained data can be used for the routine analysis of coumarin in medical plant and extracts.
Meliloti herba is defined as the dried aerial parts (especially – flowering tops) of Melilotus officinalis (L.) Pallas. or Lam. or Ders. It is known to contain coumarinic-derivatives (melilotoside, melilotin, melilotic acid, melilotin-coumaric acid). The odour of the dried herb (aromatic, pleasant, sweet) is due to these compounds; melilotoside yields coumarine upon enzymatic hydrolysis and lactonization [1].
Coumarins are an important group of phenolic com-pounds that contain the characteristic benzo[α]pyrone (2H-benzopyran-2-one) moiety. They are available from natural and synthetic sources, especially abundant in Umbel liferae, Rutaceae, Legiminosae, Compositae and other plant families [2,3]. Coumarin appear in plants as free mole-cules and glycosides; they derive from phenylpropanoid precursors, such as cinnamic acid and p-coumaric acid, which initially suffer o-hydroxylation to o-coumaric acid and 2,4-dihydroxycinammic acid, respectively. After cis/trans isomerization and spontaneous lactonization, coumarin, and 7-hydroxycoumarin (umbelliferone) are generated. Most of coumarin aglicones poses substituents (hydroxyl, methoxy, alkyl) in 7 position, sometimes also in 5, 6, 8 positions. Coumarin glycosides undergo enzymolysis in the route of drying and get converted to aglycones [4].
Coumarins are known to possess a wide range of pharmacological properties, such as antimicrobial, antiviral, anti-inflammatory, antioxidant, antiseptic, and anticoagulant activities [4]. Coumarin and its derivatives can produce rather significant side effects. In high doses, they induce headache, nausea, womiting, sleepiness, and, in extreme cases, serious liver damage [5]. It is implies the necessary standardization of plants containing coumarins with respect to the quantitative content of these biologically active substances.
For the coumarin and its derivatives separation and determination usually used chromatographic methods, especially gas chromatography [6,7] and liquid chromato-graphy [8-10]. The effective coumarin separation provides planar chromatography: thin-layer and paper. These methods show homogeneity of the isolated substances and reveal even trace amounts of coumarins [11-14]. TLC as a simple, rapid, inexpensive and high effective technique for separation of complex mixtures especially after combining with densitometric detection. That is why TLC began to be widely used not only for qualitative, but also for the quantitative estimation of various coumarins in plants, food and drugs [13,14]. But a main disadvantage of TLC method is using quite toxic organic solvents: benzene, acetone, chloroform, toluene, etc [15,16].
In recent years, the ideas of “green” chemistry have been gaining popularity in the world. One of the challenges of green chemistry is to reduce the use of hazardous organic solvents. This is one of the basic principles of “green” chemistry, formulated by Anastas and Warner: “it is better to prevent the emission of pollution than to get rid of them later” [17].
One of the ways to replace toxic organic solvents in many cases can be organized solutions – solutions of surfactants with a concentration higher than the critical micelle concentration. Use of micellar mobile phases in TLC has gained popularity because of their several advantages, for example cost-effectiveness, low toxicity, and enhanced separation efficiency. Micellar mobile phases in TLC were first reported by Armstrong, et al. [18]. The most fascinating feature of micellar systems is their dual hydrophobic and hydrophilic character, which provides electrostatic and hydrophobic sites for interaction within the aqueous mobile phase, resulting in unique separations of both ionic and non-ionic solutes. Micellar mobile phases have been successfully used to separate and distinguish various organic compounds [19-22]. Unfortunately, application of pure micellar solutions usually results in poor efficiency and asymmetric chromatographic spots. Thus, small amounts of organic modifiers, most often is short chain alcohols or carboxylic acids, are added to improve the efficiency in micellar TLC [21,23].
The aim of this study was to develop and validate simple and rapid method for the coumarin assay in the Meliloti herba and its hydro-alcoholic extracts by TLC method with “green” mobile phase base on surfactant.
Chemicals, reagents and plant material
Coumarin standard (purity 99.9%) was purchased from Sigma-Aldrich (St. Louis, MO, USA). Solvents: propanol-2 (> 99.0% v/v), methanol (> 99.0% v/v), ethanol (96.0% v/v), were analytical (Sigma AR) grade. Surfactant Tween-80 (density 1.065 g/mL) was from AppleChem GmbH, Germany. Acetonitrile and phosphoric acid were HPLC grade (Fluka, Buchs, Germany).
Plant material – Melilotus officinalis – were from Sumifitofarmacia, Ukraine. It was cropped in 2020 in Ukraine, and is dried fragmented parts of a mixture of leaves, flowers and stems of Meliloti herba.
Instruments
Micellar TLC-densitometric determination used CAMAG TLC Scanner 3 and CAMAG TLC sampler Linomat 5 (CAMAG, Muttenz, Switzerland) supplied with a 100-μL syringe. Slit dimensions were 5.00x0.20 mm with a band weigh of 8.0 mm. The scanning speed was 10 mm/s and data resolution was 100 μm/step. The resulting output was chromatogram and integrated peak area.
A rectangular flat bottomed development tank (CAMAG, Muttenz, Switzerland) was used for thin-layer chromatograms development.
Polyethylene terephthalate-backed plates Sorbfil-PTCX-P-A-UV-254 (10 x 15 cm, 100-µm thickness, IMID Ltd, Krasnodar, Russian Federation) were used.
HPLC analysis was done by using Shimadzu LC-20 chromatograph (Shimadzu Corp, Duisburg, Germany).Chromatographic column was LiChrospher 100-RP18ec (length and internal diameter 250 mm x 4.6 mm, 5um particle size, Fisher Scientific UK Ltd, GB). Mobile phase was acetonitrile – 5 g/L solution of phosphoric acid (22:78 v/v); flow rate 1.5 mL/min; detection wavelength was 275 nm; column temperature 30 OC [24].
Preparation of standard solutions
Coumarin stock solution was prepared by dissolving 50 mg accurately weight in ethanol in 50-mL volumetric flask, adjusted to volume by the same solvent to yield concentration 1 mg/mL. This solution was stored a refrigerator at 4-8 OC.
Working standard solutions were prepared by dilution corresponding aliquot of the coumarin stock solution in 50-mL volumetric flask by ethanol to obtain coumarin concentration 20-100 μg/mL. These solutions were freshly prepared and used during one working day.
Sample and extracts preparation
Sample preparation was performed by hot extraction method [24]: to 5.00 g of the powdered herbal drug add 90 mL of methanol and boil under a reflux condenser for 30 min. Allow to cool. Filter under vacuum through a fibre-glass filter. Take up the residue and the fragmented filter with 90 mL of methanol. Treat as the same manner as before. Combine the filtrates and dilute to 250.0 mL with methanol.
The sample solution was diluted 1:1 by methanol and applied to the plate to micellar TLC analysis.
For the extracts preparation the filtrational extraction method [25,26] was used. Extraction was performed at 20-25 OC with ethanol (96% or 70% v/v) at ratio raw material: extractant 1:10. Sample weight was 100.0 g of powdered plant material.
Three extracts were obtained by this way: Extract 1 – extractant ethanol 96% (v/v); Extract 2 – plant material previously extracted by ethanol 96% was secondary extracted by ethanol 70% (v/v); Extract 3 – extraсtant ethanol 70% (v/v). Extracts without pre-treatment were applied to the plate to micellar TLC analysis.
Methodology of micellar TLC
All investigation was at temperature 20+1 OC. The working standard solutions and investigated extracts were applied to the chromatographic plate 10x15 cm size as bands 8 mm by using CAMAG TLC sampler Linomat 5. The chromatographic development was performed in unsaturated chromatographic chamber to a distance about 8.5 cm using micellar mobile phase: 5x10⁻⁴ mol/L Tween-80 in a mixture propanol-2 – water (5:95 v/v). After development, the plate was dried in warm air and scanned at wavelength 275 nm using CAMAG TLC Scanner 3.
Data sources, software and processing
The statistical analyses were performed with Microsoft Excel 2010 (Microsoft Corporation, http://office.microsoft.com) and Statistica 6.0 (2001, StatSoft Inc, http://www.statsoft.com).
Method optimization
The mobile phase composition and concentration ratio were firs optimized to establish the coumarin determination in Meliloti Herba by densitometric micellar TLC method. The type of surfactant and volumetric fraction of organic modifier were firstly investigated.
Preliminary experiment showed that nonionic surfactant is best micelle-forming agent for the coumarin and its hydroxyl and methoxy derivatives separation. Tween 80 was chosen as micelle-forming agent, but when pure micellar solution was used as mobile phase, coumarin spot form was not well for its densitometric estimation. To improve of the chromatographic spot shape it was necessary to add organic modifier. It turned out that addition of acidic organic modifiers (carboxylic acid) leads to a significantly decrease of the coumarin retention, but in the same time small amounts of these modifiers result in impairment of the shape of the coumarin spot form. That is why our further investigation was carried out only with different alcohols, and propanol-2 finally was chosen as organic modifier. Optimal ratio retention – spot sharp – selectivity was obtained by using mobile phase as 5x10⁻⁴ mol/L Tween-80 in a mixture propanol-2 – water (5:95 v/v). In Figure 1 we can see the 2D chromatogram, obtained in optimal micellar TLC conditions.
UV-specter of coumarin shows two characteristic maxima: at 275 nm and 312 nm. First is more intensive, that is why 275 nm was chosen as detection wavelength.
Method validation
The method was validated according to the International Conference on Harmonization (ICH) guidelines [27] and recently published works on TLC methods validation [28-31] in terms of linearity, inter- and intra-day precision, repeatability, accuracy, selectivity, limits of detection and quantitation. Robustness study also was performed.
Specificity: The specificity of the method was confirmed by analyzing the standard and extracts. The band for coumarin in the extracts was confirmed by comparing the retention factor value (Figure 1) and spectra of the band with those of the standard. The coumarin peak purity was assessed by comparing the spectra in the peal start, peak apex and peak end position of the band.
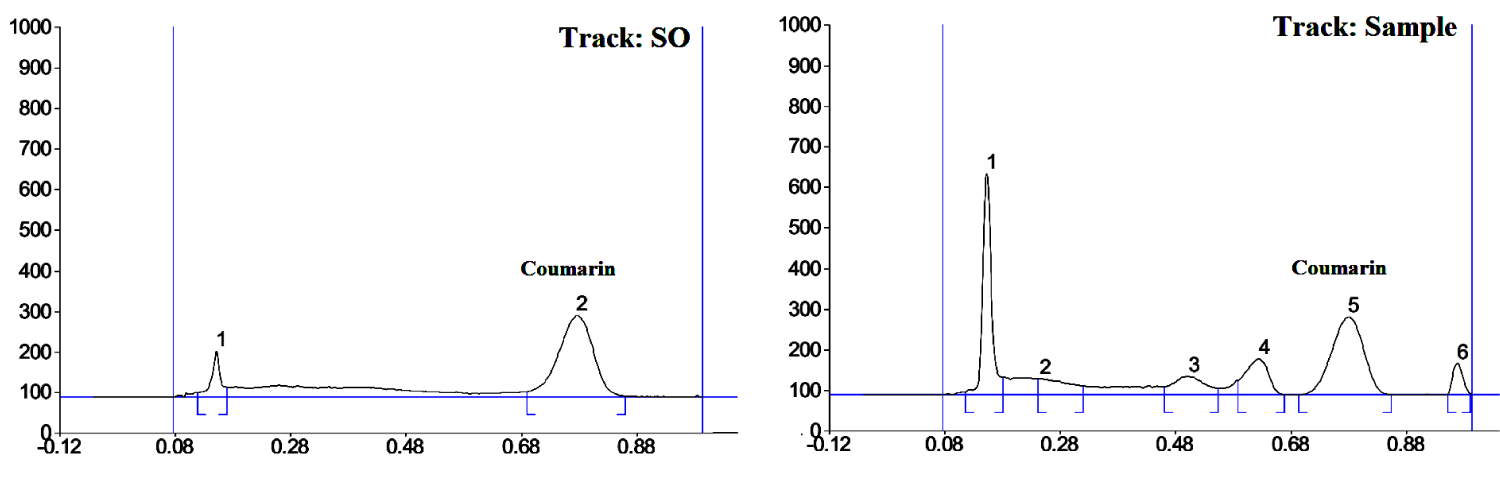
Figure 1: 2D micellar TLC densitogrtam of coumarin standard (RF = 0.80 ± 0.02) and Meliloti herba extract (RF = 0.78 ± 0.02) determination using 5x10⁻⁴ mol/L Tween-80 in a mixture propanol-2 – water (5:95 v/v) as developing system at 275 nm detection wavelength.
Linearity, LOD and LOQ: Preliminary experiment for linearity investigation (diapason from 0.1 to 10 µg/band with step 1 µg/band) showed, that dependence of coumarin peak area vs its concentration has the significant deviation from linearity at coumarin concentration above 3 µg/band, but it is well described by the second-order polynomial equation. The good linearity response of coumarin determination was in the range of 0.1-2(3) µg/band, and in this range the linearity was investigated more detailed.
Five concentrations of coumarin within the specified range were applied in triplicate. The calibration curve was constructed by plotting the coumarin peak area corresponding to its concentration. Regression data showed very good linearity within the specified range.
Limits of detection (LOD) and quantitation (LOQ) were calculated in accordance with the 3.3N/B and 10N/B criteria, respectively, where N is a standard deviation of the spot area of the estimate, and B is the slope of the calibration curve. The results obtained were:
• Range: 0.1-2.5 μg/band;
• Linearity equation: Y = 74.3 + 11083.5X
• Correlation coefficient (r): 0.99932
• RSD of slope (%): 0.7
• RSD of intercept (%): 2.1
• LOD (μg/band): 0.015
• LOQ (μg/band): 0.045
Accuracy: Three standard samples with coumarin concentration 0.22, 0.67 and 1.12 μg (calculated on applied band) were reanalyzed by the proposed method. Results obtained during accuracy investigations are presented in Table 1. The method showed a good accuracy. Also the standard addition techniques was carried out; the good recoveries were obtained and given in Table 2.
| Table 1: Accuracy, repeatability (intra-day) and reproducibility (inter-day) precision data for coumarin determination by micellar TLC. | |||||
| Accuracy | |||||
| Coumarin concentration, μg/band (100%) | Experimental concentration founded*, μg/band | Accuracy, % | ∆ | ||
| 0.22 | 0.217 | 98.8 | -1.2 | ||
| 0.67 | 0.665 | 99.2 | -0.8 | ||
| 1.12 | 1.117 | 99.7 | -0.3 | ||
| Mean, RSD, % | 99.2, 0.3 | ||||
| Repeatability and reproducibility | |||||
| Coumarin concentration, μg/band | Intra-day* Mean, % ± RSD, % |
Inter-day * | |||
| Relative amount, % ± RSD, % | |||||
| Day 1 | Day 2 | Day 3 | |||
| 0.22 | 99.1 ± 0.5 | 100.2 ± 0.5 | 99.0 ± 0.7 | 99.6 ± 0.7 | |
| 0.67 | 100.1 ± 0.3 | 99.3 ± 0.9 | 100.1 ± 0.5 | 101.2 ± 0.7 | |
| 1.12 | 99.4 ± 0.4 | 100.8 ± 0.8 | 99.6 ± 0.7 | 100.2 ± 0.5 | |
| * mean value of the three determinations. | |||||
| Table 2: Results of recovery study. | ||||
| Amount present (μg/band) | Amount spiked (μg/band) | Amount found (μg/band) | % Recovery | Average % recovery |
| 0.22 | 0.22 0.45 0.67 |
0.214 0.440 0.662 |
97.38 97.85 98.78 |
98.0 |
| 0.67 | 0.22 0.45 0.67 |
0.217 0.446 0.668 |
98.85 99.23 99.78 |
99.3 |
| 1.12 | 0.22 0.45 0.67 |
0.217 0.447 0.662 |
98.55 99.34 98.88 |
98.9 |
Precision: The repeatability (intra-day) and intermediate (inter-day) precision of the sample application and mea-surement of peak area were carried out using 9 determinations (3 concentrations/3 replicates), covering the specific range for the micellar TLC method, and were expressed in terms of RSD (%). The obtained results are summarized in Table 1. The proposed method showed good precision.
Robustness: To measure robustness, the experimental conditions were deliberately changed slightly, and the effect on the results was examined. The studied parameters were chromatographic chamber saturation time, mobile phase composition and scanning wavelength.
Changing concentration of Tween 80 (3-7 x 10⁻⁴ mol/L) and time of chromatographic chamber saturation (unsaturated, saturation 30, 60 and 90 min) had no significant effect on RF value of coumarin (RF = 0.79 + 0.03).
Scanning wavelength changing (+ 2 nm) also no showed significant effect both coumarin retention and the assay data.
The change in the organic modifier volume fraction made the main effect in the coumarin retention. When propanol-2 volume fraction was changed, the coumarin retention factor was changed from 0.70 (4% of 2-PrOH) to 0.86 (6% 2-PrOH). Investigation results shows, that these changes did not produce significant effect on the separation selectivity and coumarin assay.
Solution stability: In order to avoid any unexpected changes in the stock and working solutions during the analysis due to delay in the analysis time, we must have detailed information about the stability of the prepared solutions. It was found that ethanolic stock solution of coumarin was stable at least 10 days when stored refrigerated at 4-8 OC and it showed no chromatographic or absorbance changes.
In the same time ethanolic working solutions of coumarin were stable near 24 hours at room temperature when protected from light. After 48 hours we founded chromatographic peak area decreasing. That is why these solutions should be freshly prepared.
Analytical application
The coumarin assay in the Meliloti herba and its ethanolic extracts were obtained by the proposed micellar TLC method. All results are presented in Table 3. Results obtained were compared to results obtained from HPLC method described in [24]. Student t-test and F-test were used for the comparison obtained results (Table 3). As can be seen coumarin contents differ insignificantly, and proposed micellar TLC method can be an alternative method for rapid coumarin determination in the plant materials. Typical densitogram obtained during coumarin assay is presented in Figure 2.
| Table 3: Results of coumarin assays using RP-HPLC and micellar TLC methods. | |||||||
| Sample | MTLC*, % | RP-HPLC*, % | ∆ | Calculated F - values | Calculated t - values | ||
| Meliloti herba*** | 0.33 ± 0.03 | 0.31 ± 0.01 | ± 0.02 | 1.36 | 1.73 | ||
| Extract 1 | 0.14 ± 0.03 | 0.12 ± 0.02 | ± 0.02 | 2.12 | 1.94 | ||
| Extract 2 | 0.17 ± 0.03 | 0.14 ± 0.02 | ± 0.03 | 2.55 | 1.88 | ||
| Extract 3 | 0.26 ± 0.04 | 0.22 ± 0.02 | ± 0.04 | 2.02 | 2.28 | ||
| F** = 6.39 | t** = 2.78 | ||||||
| * – mean value of the three determinations; ** – tabulated t and F values are given for p = 95%; *** – coumarin content not less 0.3% calculated on dried drug [24]. | |||||||
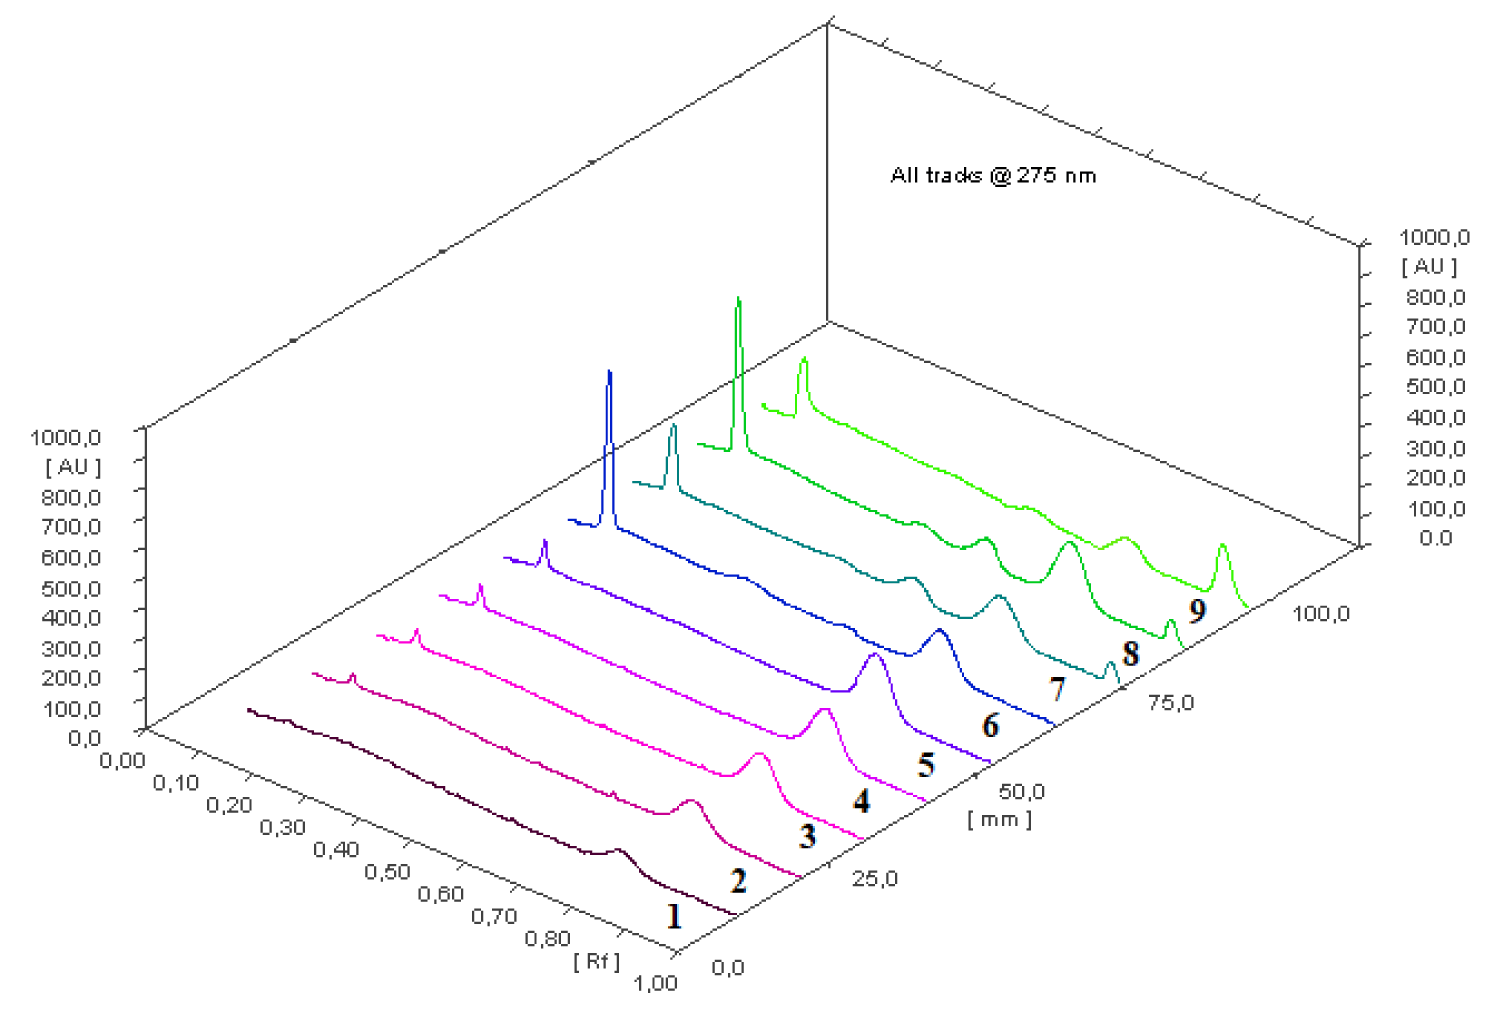
Figure 2: Micellar TLC chromatogram (3-dimentional) obtained during coumarin assay. Micellar mobile phase: 5 x 10⁻⁴ mol/L Tween-80 in a mixture propanol-2 – water (5:95 v/v); Tracks 1–5: coumarin working standard solutions (0.22, 0.45, 0.67, 0.90, 1.12 µg/band, respectively); track 6: Extract 1 sample solution; track 7: Extract 2 sample solution; track 8: Extract 3 sample solution; track 9: Meliloti herba sample solution.
As can we seen from Table 3 the most complete extraction takes place with using 70% ethanol as extractant.
A validated micellar TLC analytical method has been developed for the quantification of coumarin in Meliloti herba and its ethanolic extracts. The proposed method is simple, fast, precise, specific and accurate. The statistical analysis of data obtained proves that the method is reproducible and can be used for routine analysis for the coumarin determination. The high accuracies of the assays obtained, taken together with the low solvent consumption and replacing hazardous solvents by greener ones made these methods eligible for use in different laboratories as alternative existed chromatographic methods for routine and fast coumarin determination.
- Bruneton J. Pharmacognosie. Phytochimie, Plantes médicinales. 4e éd., EM Inter / Lavoisier Tec & Doc, Paris. 2009; 1-270.
- Luca SV, Głowniak K, Skalicka-Woźniak K. Coumarins: Analytical and Preparative Techniques. In Encyclopedia of Analytical Chemistry, Online ©2006-2018 John Wiley & Sons, Ltd. 2018.
- Glowniak K, Widelski J. Coumarins: TLC Analysis. In: Encyclopedia of Chromatography, Third Edition. Jack Cazes Ed., CRC Press 2009; 2850.
- Waksmundzka-Hajnos M, Hawrył M. Application of TLC in the Isolation and Analysis of Coumarins. In: Thin Layer Chromatography in Phytochemistry. Eds: Waksmundzka-Hajnos M, Sherma J, Kowalska T, CRC Press 2020; 896.
- Lozhkin AV, Sakanyan EI. Natural coumarins: Methods of isolation and analysis. Pharm Chem J. 2006; 40; 337–346.
- Ananthakrishnan R, Chandra P, Kumar B, Rameshkumar KB. Quantification of coumarin and related phenolics in cinnamon samples from south India using UHPLC-ESI-QqQLIT-MS/MS method. Int. J Food Propert. 2018; 21: 50-57.
- Zheng Y, Xu X, Yuan F, Yao M, Ji S, et al. Simultaneous Analysis of Simple Coumarins and Furocoumarines in Cigarettes by Solid-Phase Extraction with Gas Chromatography-Mass Spectrometry. J AOAC Int. 2017; 100: 1559–1564. PubMed: https://pubmed.ncbi.nlm.nih.gov/28425389/
- Maggi F, Barboni L, Caprioli G, Papa F, Ricciutelli M, Sagratini G, Vittori S. HPLC quantification of coumarin in bastard balm (Melittis melissophyllum L. Lamiaceae). Fitoterapia. 2011; 82; 1215–1221. PubMed: https://pubmed.ncbi.nlm.nih.gov/21907267/
- Wang S, Tang F, Yue Y, Yao X, Wei Q, et al. Simultaneous Determination of 12 Coumarins in Bamboo Leaves by HPLC. J AOAC Int. 2013; 96; 942–946. PubMed: https://pubmed.ncbi.nlm.nih.gov/24282929/
- Hrobonová K, Lehotay J, Cižmárik J, Sádecká J. Comparison HPLC and fluorescence spectrometry methods for determination of coumarin derivatives in propolis. J Liq Chromatogr Relat Technol. 2013; 36: 486–503.
- Bieganowska M, Petruczynik A, Zobel A. Retention parameters of coumarins and flavonoids in binary reversed-phase HPTLC systems. J Planar Chromatogr. 1996; 9: 273-279.
- Glowniak K, Bieganowska M. Reversed-phase systems for the separation of coumarins and furocoumarins by Thin-Layer and High-Performance Liquid Chromatography. J Liq Chromatogr. 1985; 8: 2927-2947.
- Hawrył M, Soczewiński E, Dzido T. Separation of coumarins from Archangelica officinalis in high-performance liquid chromatography and thin-layer chromatography systems. J Chromatogr A. 2000; 886: 75-81. PubMed: https://pubmed.ncbi.nlm.nih.gov/10950277/
- Krüger S, Winheim L, Morlock GE. Planar chromatographic screening and quantification of coumarin in food, confirmed by mass spectrometry. Food Chem. 2018; 239: 1182–1191. PubMed: https://pubmed.ncbi.nlm.nih.gov/28873538/
- Pascual ME, Carretero ME, Slowing KV, Villar A. Simplified Screening by TLC of Plant Drugs. Pharmaceuti Biol. 2002; 40: 139-143.
- Lončar M, Jakovljević M, Šubarić D, Pavlić M, Buzjak Služek V, et al. Coumarins in Food and Methods of Their Determination. Foods. 2020; 9: 645. PubMed: https://www.ncbi.nlm.nih.gov/pmc/articles/PMC7278589/
- Anastas PT, Warner JC Eds. Green Chemistry: Theory and Practice. Oxford University Press, 1998; 135.
- Armstrong DW, McNeely M. Use of Micelles in the TLC Separation of Polynuclear Aromatic Compounds and Amino Acids. Anal Lett. 1979; 12: 1285–1291.
- Sherma J, Sleckman BP, Armstrong DW. Chromatography of Amino Acids on Reversed Phase Thin Layer Plates. J Liq Chromatogr. 1983; 6: 95-108.
- Repina N, Konovalova O, Kalinin D, Edamenko D. Thin-layer chromatographic separation of a number of bile acids with mobile phases based on surfactants. J Planar Chromatogr Modern TLC. 2020; 33: 271–279.
- Kulikov AYu, Renkevich AYu, Boichenko AP. Development and Validation of Assay and Stability-Indicating of gamma-Aminobutyric Acid in Tablets by Micellar Thin-Layer Chromatography. Methods Objects Chem Anal. 2015; 10: 73-79.
- Ciura K, Belka M, Kawczak P, Bączek T, Nowakowska J. The comparative study of micellar TLC and RP-TLC as potential tools for lipophilicity assessment based on QSRR approach. J Pharm Biomed Anal. 2018; 149: 70–79. PubMed: https://pubmed.ncbi.nlm.nih.gov/29101818/
- Shtykov SN, Sumina EG, Uglanova VZ, Sorokina ON. Thin-layer chromatography of some amino acids on silica in aqueous–organic and modified micellar mobile phases. J Anal Chem. 2017; 72: 870–878.
- European pharmacopoeia 10th ed. PubMed: https://pheur.edqm.eu/home
- Popova TP, Litvinenko VI. Nekotorye obshhie zakonomernosti izvlechenija dejstvujushhih veshhestv iz lekarstvennogo syr’ja. Soobshh. 1. // Farmakom (Rus). 1993; 1: 13–15.
- Popova TP, Ammosov AS, Litvinenko VI, Mishev VM. Fil’tracionnaja jekstrakcija i ee apparaturnoe oformlenie. Farmakom (Rus). 1994; 2–3: 43–49.
- Validation of Analytical procedures: Text and Methodology Q2 (R1). http://www.ich.org
- Ermer J, Ploss HJ. Validation in pharmaceutical analysis: Part II: central importance of precision to establish acceptance criteria and for verifying and improving the quality of analytical data. J Pharm Biomed Anal. 2005; 37: 859-870. PubMed: https://pubmed.ncbi.nlm.nih.gov/15862659/
- Shewiyo DH, Kaale E, Risha PG, Dejaegher B, De Beer J, et al. Accuracy profiles assessing the validity for routine use of high-performance thin-layer chromatographic assays for drug formulations. J Chromatogr A. 2013; 1293: 159-169. PubMed: https://pubmed.ncbi.nlm.nih.gov/23639129/
- Shewiyo DH, Kaale E, Risha PG, Dejaegher B, De Beer J, et al. HPTLC methods to assay active ingredients in pharmaceutical formulations: A review of the method development and validation steps. J Pharm Biomed Anal. 2012; 66: 11-23. PubMed: https://pubmed.ncbi.nlm.nih.gov/22494517/
- Renger B, Végh Z, Ferenczi-Fodor K. Validation of thin layer and high performance thin layer chromatographic methods. J Chromatogr A. 2011; 1218: 2712–2721. PubMed: https://pubmed.ncbi.nlm.nih.gov/21329932/