
More Information
Submitted: December 19, 2022 | Approved: January 04, 2023 | Published: January 05, 2023
How to cite this article: Chakoyan O. Rapid determination of PCDDs, PCDFs and DL-PCBs in foods, feeding stuffs and vegetable oils using new modified acid silica. Ann Adv Chem. 2023; 7: 001-013.
DOI: 10.29328/journal.aac.1001037
Copyright License: © 2023 Chakoyan O. This is an open access article distributed under the Creative Commons Attribution License, which permits unrestricted use, distribution, and reproduction in any medium, provided the original work is properly cited.
Keywords: Oil; Extraction; Polychlorinated-p-Dioxins; Polychlorinated dibenzofurans; Polychlorinated biphenyls; GC/MS/MS

Rapid determination of PCDDs, PCDFs and DL-PCBs in foods, feeding stuffs and vegetable oils using new modified acid silica
Ovanes Chakoyan*
Department of Chromatography, Fidelitas Lab, Varna, Bulgaria
*Address for Correspondence: Ovanes Chakoyan, Department of Chromatography, Fidelitas Lab, Varna, Bulgaria, Email: [email protected]
Polychlorinated dibenzo-p-dioxins, dibenzofurans and dioxin-like polychlorinated biphenyls are persistent organic pollutants (POPs), which in recent years received huge attention due to their extreme stability, high potential toxicity and bioaccumulation in food chains. The main source of human exposure to these compounds is discovered in foods of animal origin, especially foods rich in fat. The target of the present study was to set up an analytical method for the determination of PCDDs/PCDFs and DL-PCB in vegetable oils, sunflower meals, sunflower seeds, rapeseeds and milk powder. The first step consisted of a semi-automatic Soxhlet extraction for 3 hours, by using a mixture of Hexane: Acetone – 80:20, followed by acid digestion with 55% acid silica and filtration. After concentration, the extract is purified on a multilayer column (silica gel, silica-KOH, silica-H2SO4 anhydrous Na2SO4) followed by an alumina column separation in two fractions (first fraction containing PCDDs/PCDFs and second containing only PCBs). The purified extract was then analyzed by GC/MS/MS. The newly developed approach in our lab was capable to reduce the overall time of sample preparation to seven hours/ per sample. Since the method shows good mean recoveries for all labeled congeners spiked in the samples (for PCDDs/PCDFs – 80% - 110%, for DL-PCBs – 70% - 85%), we assumed the absence of overestimation or underestimation in the analyzed samples.
Dioxins are a group of persistent chemicals that are not produced intentionally but are formed during combustion (burning) processes and as by-products of industrial processes. PCBs, polychlorinated biphenyls, have a similar chemical structure as dioxins. They have been used in transformers, building materials, lubricants, coatings, plasticizers and inks, although their use has now largely been phased out. Both the dioxins and the PCBs are highly resistant to breakdown processes and consequently persist in the environment, followed by uptake into the food chain. Up to 90% of human exposure to dioxin results from the consumption of food containing dioxins, mainly feedstuffs of animal origin with high-fat content, since these contaminants accumulated in fatty tissues. Foodstuff in which dioxins can occur includes meat, fish, eggs and milk.
The term ‘’dioxin’’ covers a group of 75 chemically similar polychlorinated Dibenzo-P-Dioxins (PCDDs) and 135 Polychlorinated Dibenzofurans (PCDFs). Each individual compound in the separate group is termed a congener.
Figure 1 shows the general structure of PCDDs and PCDFs.
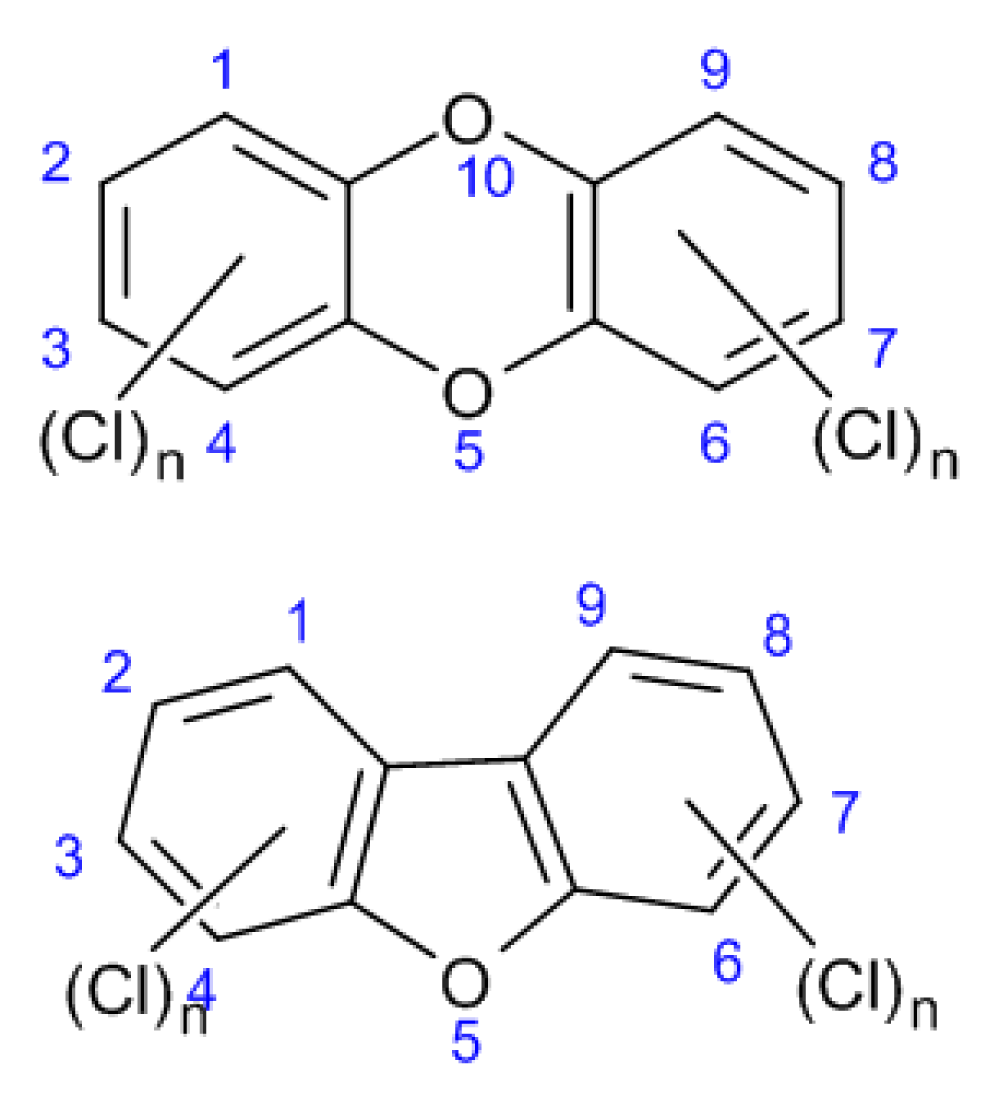
Figure 1: General structures of PCDDs and PCDFs.
The general structure of these compounds represents planar, tricyclic aromatic ether that can have up to eight chlorine atoms attached to carbon atoms in the benzene rings. The number and position of chlorine atoms on the rings determine different isomers called congeners. Congeners with an equal number of chlorine atoms are called homologs and homologs with different chlorine substitutions are called isomers. In general, the term dioxins is used to refer to 75 congeners of PCDDs and 135 congeners of PCDFs (total pf 210 compounds). Of these 210 compounds, only 17 congeners (7 PCDDs and 10 PCDFs) with chlorine atoms at positions 2,3,7 and 8 showed toxicity [17].
Polychlorinated Biphenyls (PCBs) are nonpolar, chlorinated aromatic hydrocarbons with chlorine atoms from 1 to 10, generating 209 compounds (congeners) as dioxins (Figure 2).
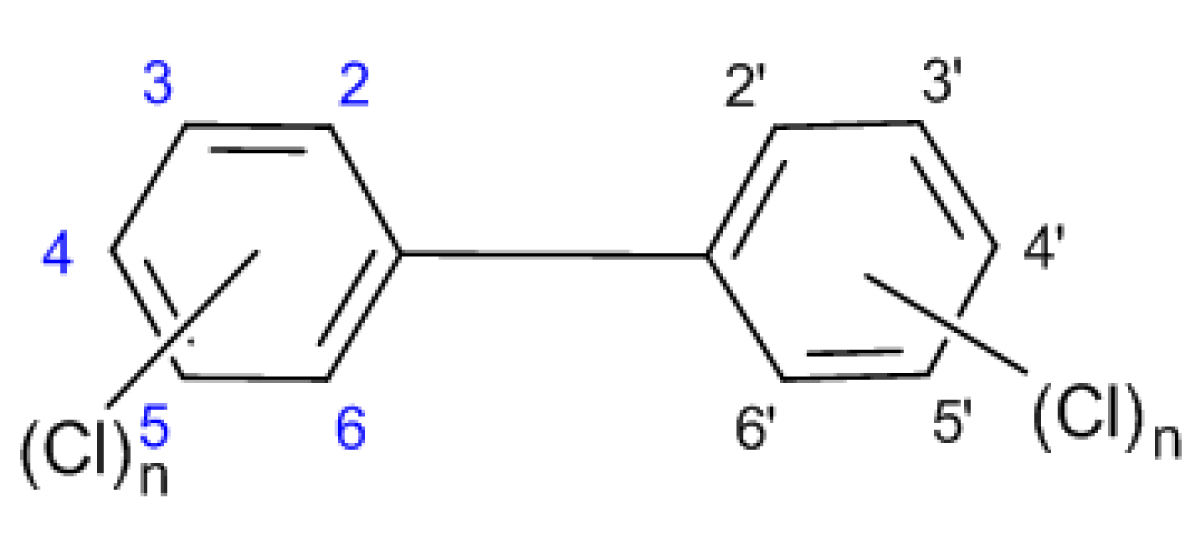
Figure 2: The general structure of PCBs.
PCBs with an equal number of chlorine atoms also called homologs, and homologs with different substitution positions are referred to as isomers. Positions 2,2’, 6 and 6’ are called ortho-positions; 3,3’, 5 and 5’ are called meta-positions; and positions 4 and 4’ are para-positions. Rings in biphenyls can be planar or nonplanar, depending on the steric and electronic effects of chlorine atoms, especially in ortho-position, where bulky chlorine atoms force aromatic benzene rings to rotate out of planar configuration. Meta- and para – PCBs have planar molecules and these compounds are called coplanar congeners (co-PCBs).
When more than two chlorine atoms in ortho-position are present, PCBs assume a nonplanar configuration and are indicated as non-planar congeners.
Due to their lipophilic nature, PCDDs, PCDFs and PCBs are usually found adhering or dissolved in rich lipid-content foodstuffs like meat, fatty fish, milk, dairy products and vegetable oils. Therefore, methods of analysis for the official control of the level of lipophilic toxic compounds in EU-regulated foods of animal and plant origin include an initial lipid extraction step (liquid-liquid extraction, PLE extraction, Soxhlet extraction), which isolates the lipids from potentially interfering compounds such as carbohydrates.
The first step in food preparation methods after extraction is the removal of lipids content completely as possible. EPA 8290, EPA 1613 and ISO 16215 recommend the use of concentrated sulphuric acid lipid digestion and also different ratio impregnated silica gel with sulphuric acid column chromatography.
Direct digestion with concentrated mineral acid leads to the carbonization of compounds of interest and therefore to low recoveries of PCDD/PCDF and PCBs.
In this study, in our lab, we performed a new approach for eliminating lipid interfering compounds, with good recoveries and without complex pre-cleanup procedures with sulphuric acid leading to huge losses and requiring very careful precautions measures. Using a novel triple quadrupole GC/MS/MS system equipped with a highly efficient detector and three forms of noise-reduction technologies. The MS analyzer was equipped with BEIS (Boosted Efficiency Ion Source) that maximizes efficiency through optimization of the focal point of the electron beam in EI ionization mode making it capable of full validation method for DL-PCBs and PCDDs/PCDFs in food and feed.
Chemicals and standards
17 native and 13C- labeled PCDDs/PCDFs congeners, 12 native and 13C-labeled DL-PCBs were selected for current study, purchased from Wellington Laboratories (Greyhound Chromatography, UK). For PCDDs/PCDFs and DL-PCBs, a nine-point calibration curve ranging from 0.01 pg/µl to 50 pg/µl and from 0.1 pg/µl to 50 pg/µl was used, respectively. 13C-labeled congeners using the isotope dilution method were present in every calibration solution at concentrations 2 pg/µl and 5 pg/µl, accordingly. All standard solutions and final extracts before injection were made of nonane (Fischer Scientific, USA).
All reagents used for the analysis of PCDDs/PCDFs and PCBs were of trace analysis grade, n-hexane, dichloromethane and acetone were supplied from Sigma-Aldrich and Fischer Scientific.
Additional equipment includes a nitrogen evaporator, a rotatory vacuum evaporator (Buchi R100, Switzerland), an analytical precision scale (RADWAG AS 220. R2, Poland), Laboratory Mill Perten 120, Sweden), a Hot extraction unit (FOSS ST243 SOXTEC, Denmark).
Sample collections
Selected sunflower meal, sunflower seed and rapeseed samples were collected at local feed processing plants and for the edible vegetable oils and milk powder, samples were collected from grocery stores throughout the city of Varna. The cereals and cereal bran samples containing barley, wheat and corn were collected from various localities of Bulgaria.
Sample preparation
Soxhlet extraction of sunflower meals, cereals, cereals-based foods and milk powder: All samples except for vegetable oils were extracted with a FOSS extraction device. Briefly, 10 g of sample was weighted to 0.01 g accuracy and placed in an extraction cell, spiked with extraction labeled 13C - PCDDs/PCDFs and DL-PCBs congeners and leave for equilibration around 30 min.
And extracted with solvent mixture Hexane: Acetone (80:20) for 3 hours. After that, the extract was evaporated to dryness. After that, sunflower meals and milk powder extract were weighed for the determination of lipid content. The whole extracts were dissolved in hexane and added 55% acid silica. The samples were shaken vigorously for 30 sec. and put into centrifugation at 5000 rpm for 5 min, filtrated and evaporated to dryness.
Extraction of sunflower seeds and rapeseeds: Briefly, 10 g milled sunflower seed and rapeseed samples were extracted for 3 hours. After concentration, the determination of lipid content was obtained gravimetrically. The extracted fat was fortified with extraction-labeled mixtures of 13C - PCDDs/PCDFs and DL-PCBs congeners and left for homogenization for around 5 min. The oilseed extracts were directly dissolved in hexane and mixed with 55% acid/silica.
Each vegetable oil was weighed around 2.5 g, dissolved in 30 ml hexane and performed acid digestion with 17 g 55% acid-silica, followed by filtration of clean extract and evaporation to dryness.
Extraction of cereals and cereal-based products: 10 g milled cereal samples were extracted with solvent mixture Hexane: DCM (1:1) for three hours, evaporated on a rotatory evaporator to dryness and subjected directly to multilayer column cleanup.
Multilayer column clean-up: All samples except cereal extract, which are directly put on multilayer column purification after filtration and evaporation to dryness, were subjected to cleanup additionally on multilayer acid/base silica column in following order (1 g silica, 5 g NaOH-silica, 10 g 44% acid-silica, 1 g sodium sulfate), with hexane. Separation of dioxins and PCBs was accomplished on the alumina column (5 g) by wet filling with hexane. The first fraction containing non-ortho and mono-ortho-PCBs was eluted by 70 ml hexane: DCM (95:5), and the second fraction with PCDDs/PCDFs was eluted with 45 ml Hexane: DCM (50:50). After evaporation to complete dryness, each fraction was quantitatively transferred to a vial with insert(300 μl volume), spiked with 13C12 - 1,2,34-TCDD/ 13C12- 1,2,3,7,8,9-HxCDD recovery standard mixture for PCDD/PCDF and 13C - PCB70, PCB 111, PCB138 and PCB 189 for DL- PCBs, concentrated to a 20 μl final volume and injected in GC/MS/MS [4,5] (Figures 3-10).
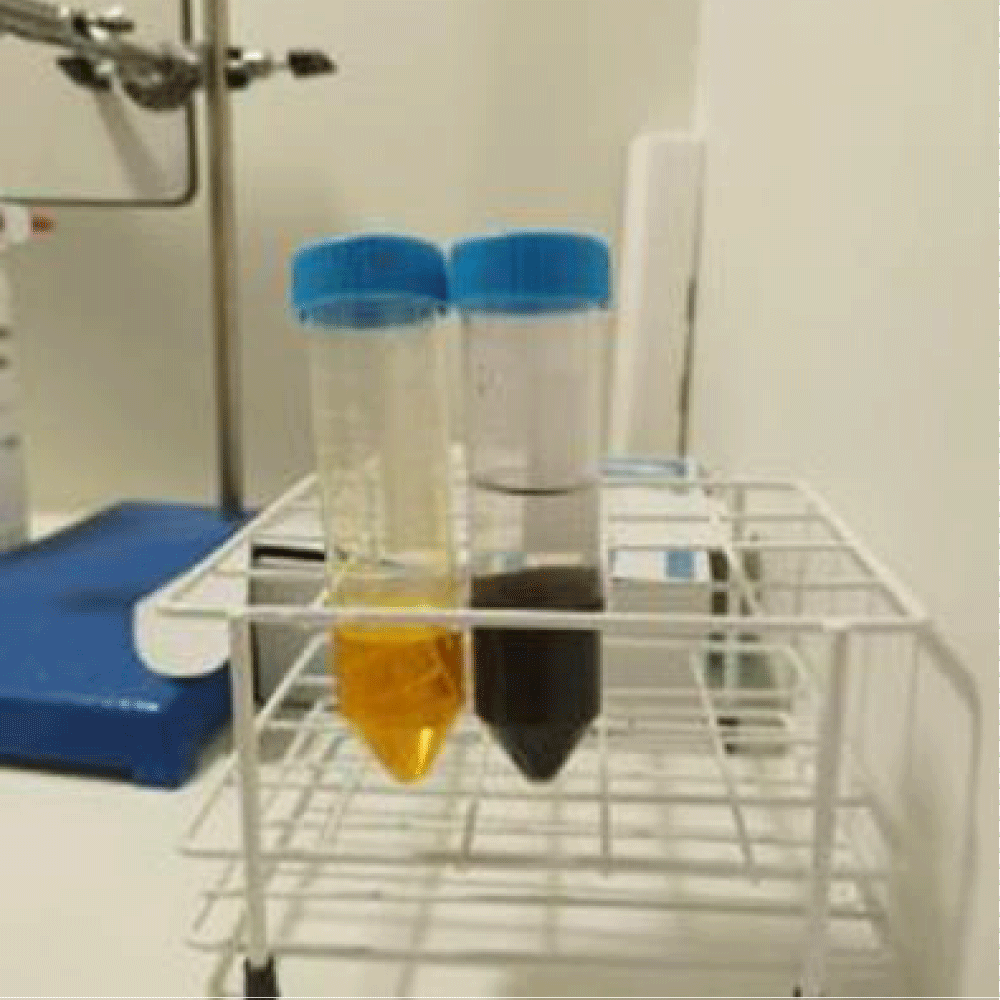
Figure 3: Vegetable oil sample, before and after acid-silica (55%) cleans up.
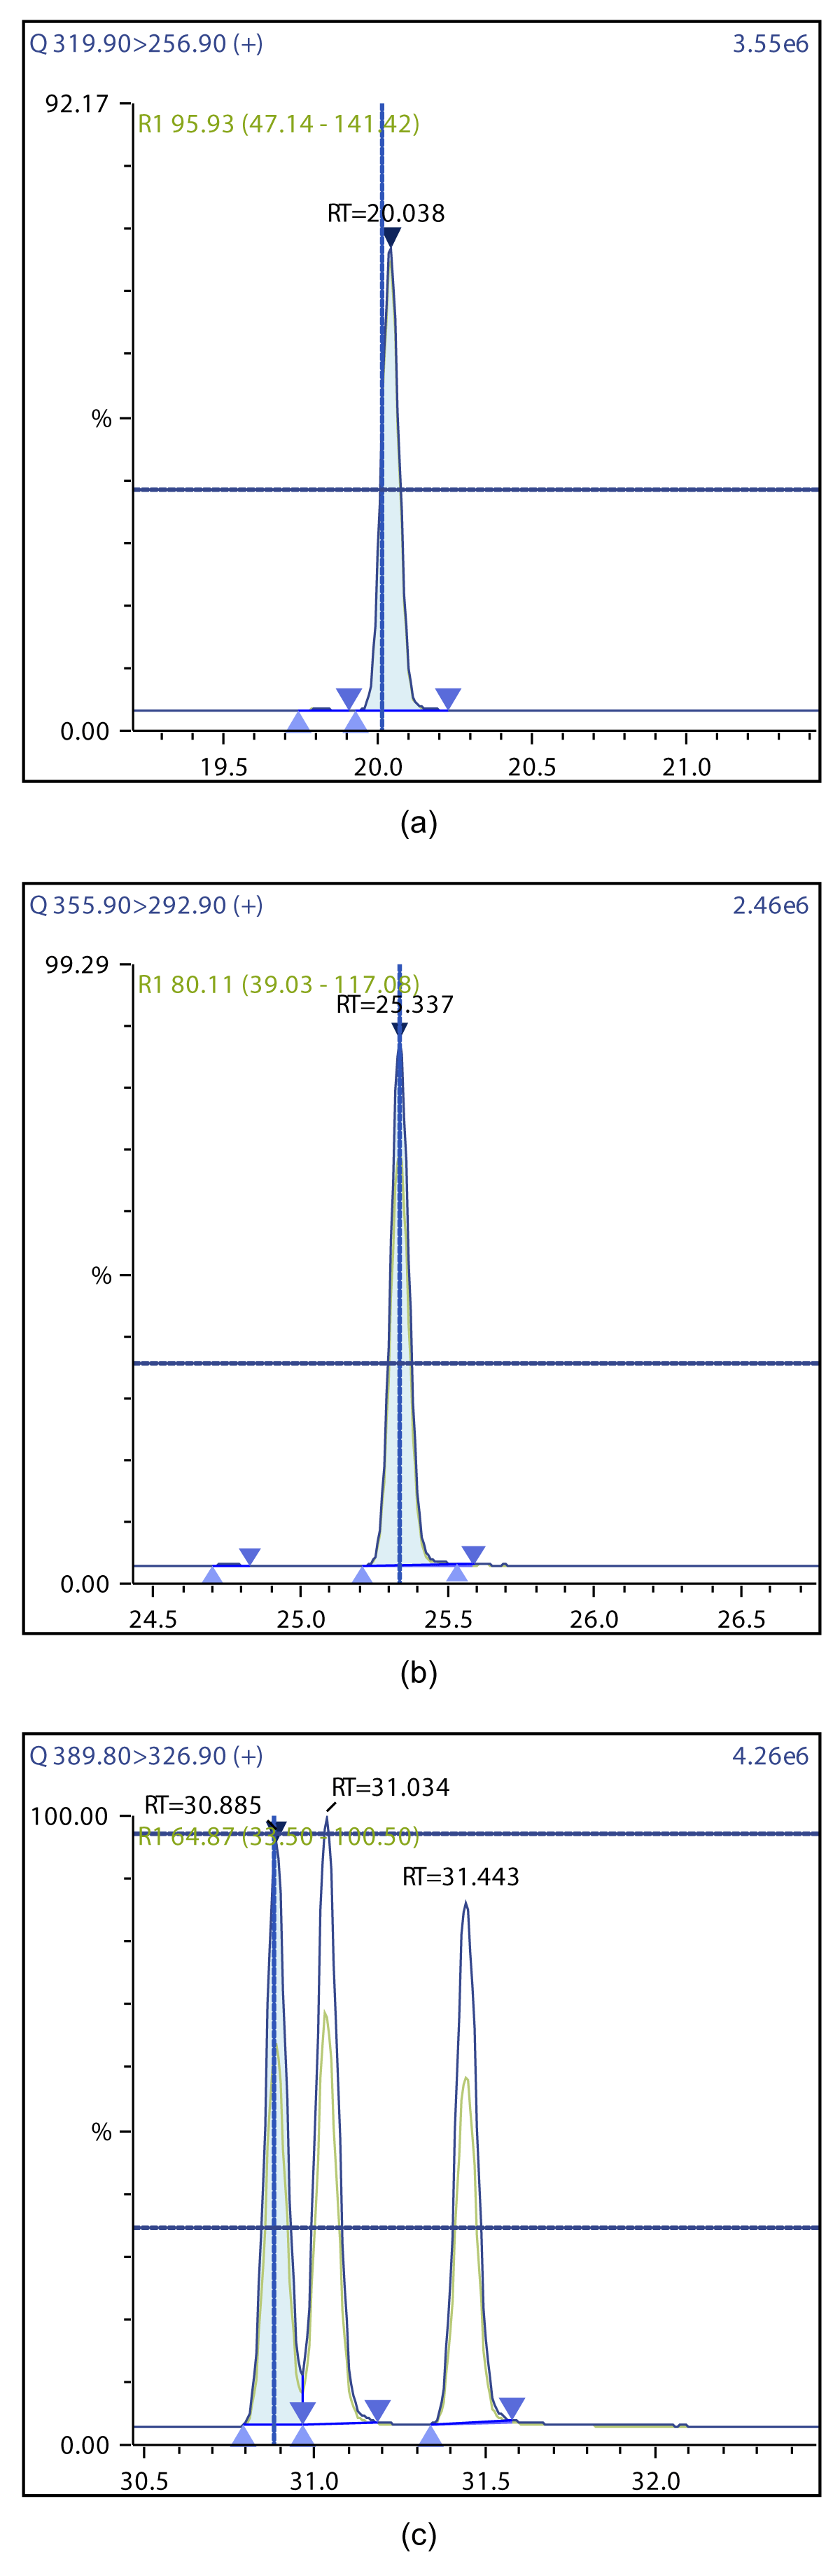
Figure 4: Chromatographic Profiles of TCDD, PCDD, and HxDD: (a) TCDD (b) PCDD (c) HxDD.
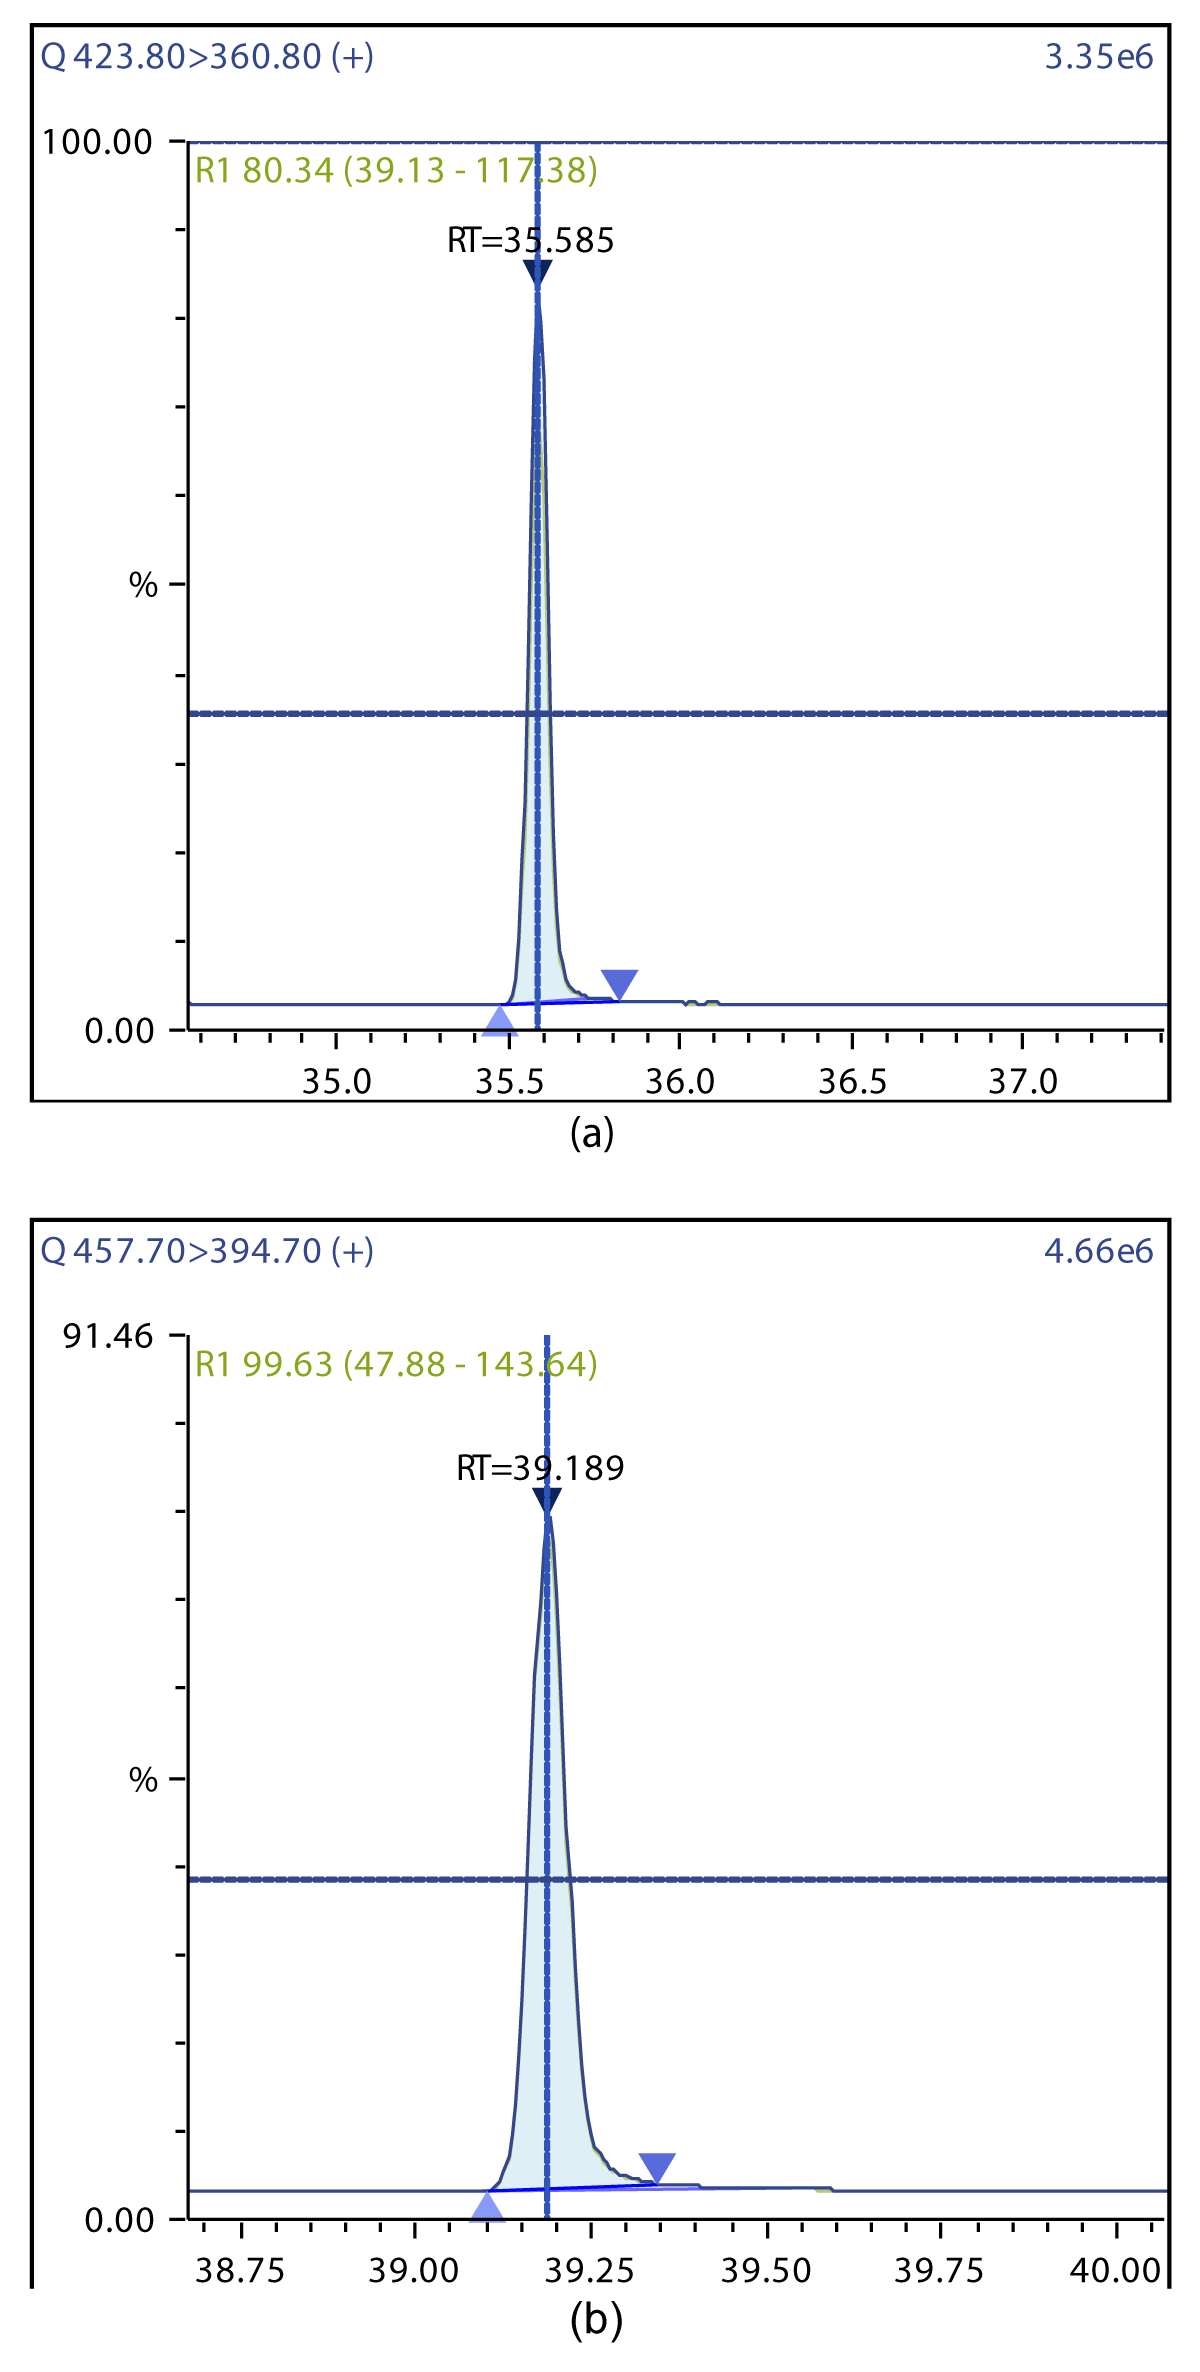
Figure 5: Chromatographic Profiles of HpDD and OCDD: (a) HpDD (b) OCDD.
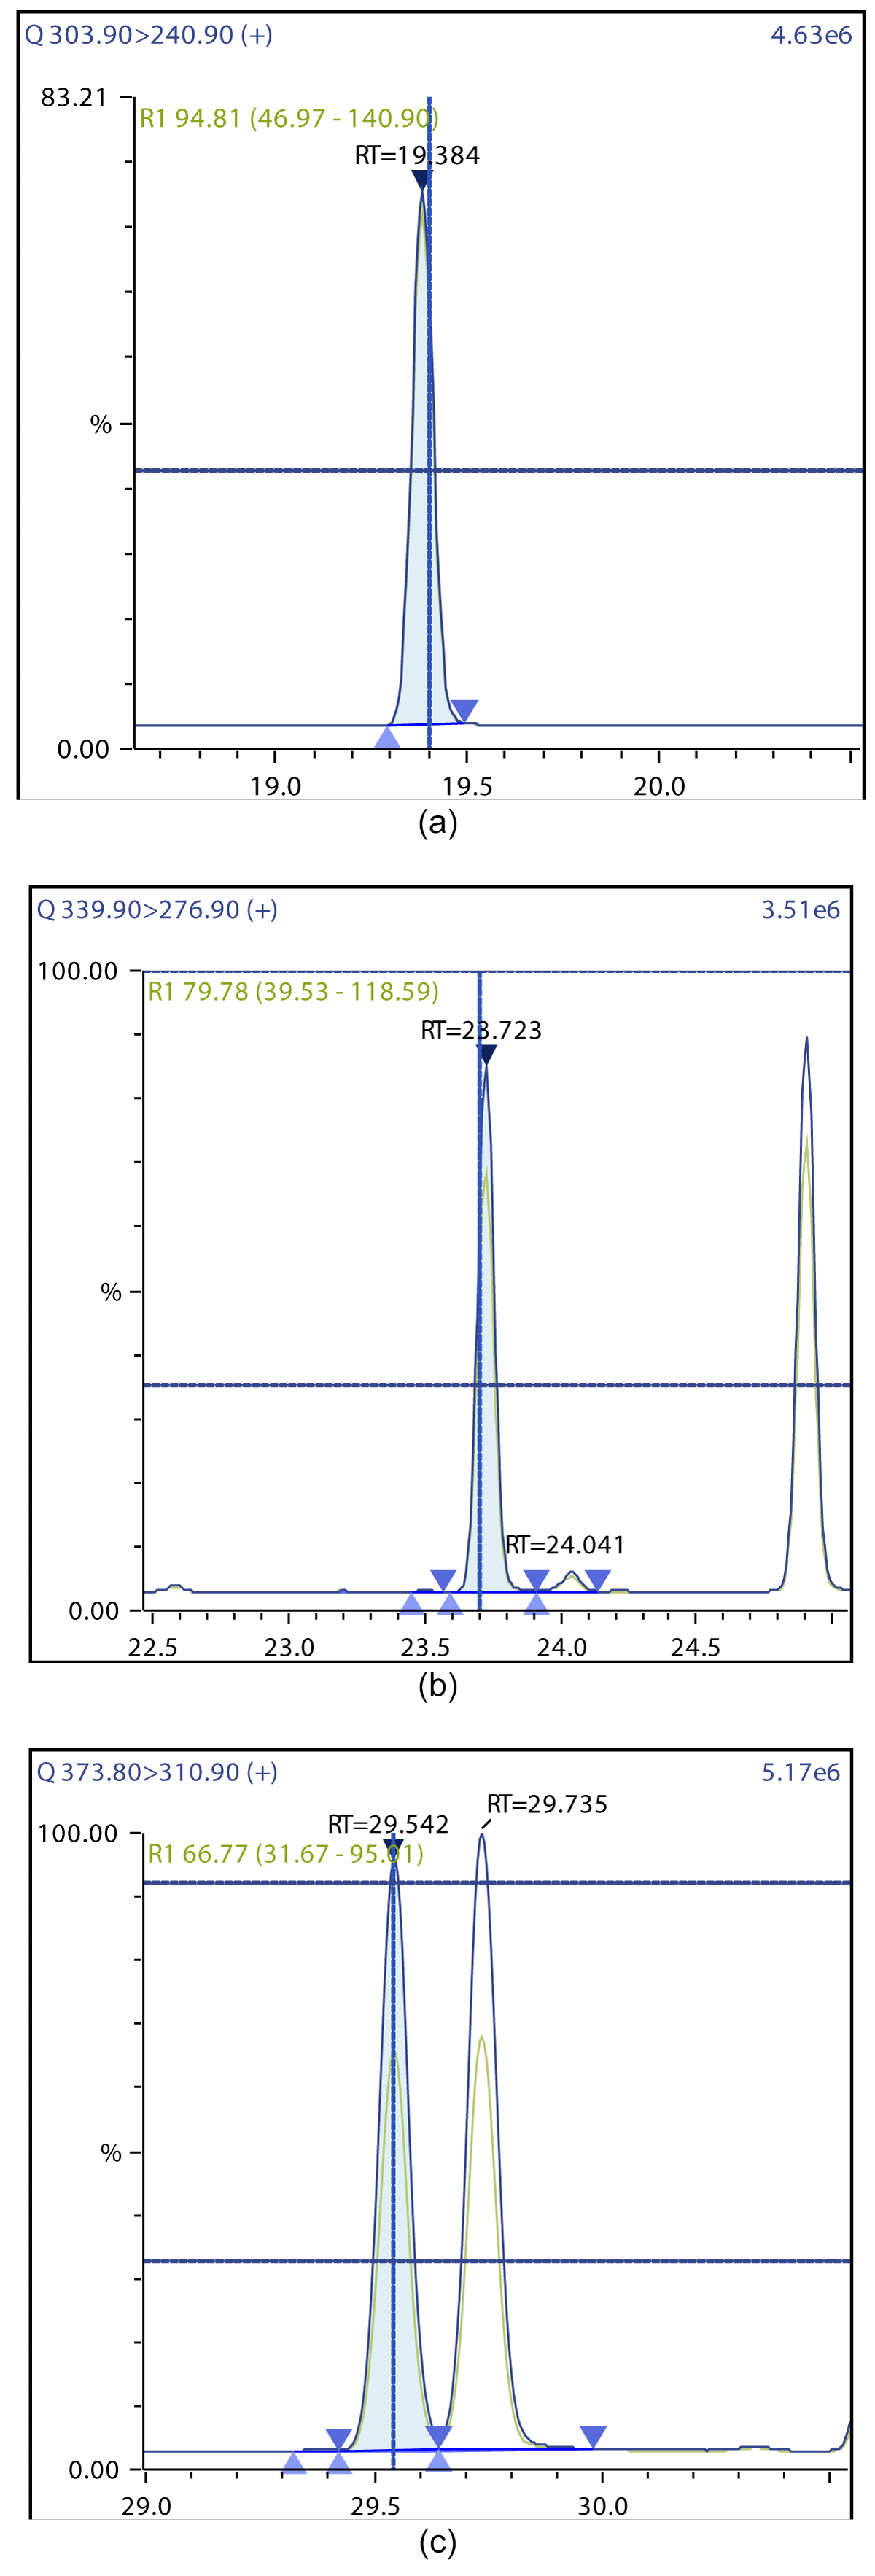
Figure 6: Chromatographic Profiles of TCDF, PCDF and HxDF: (a) TCDF (b) PCDF (c) HxDF.
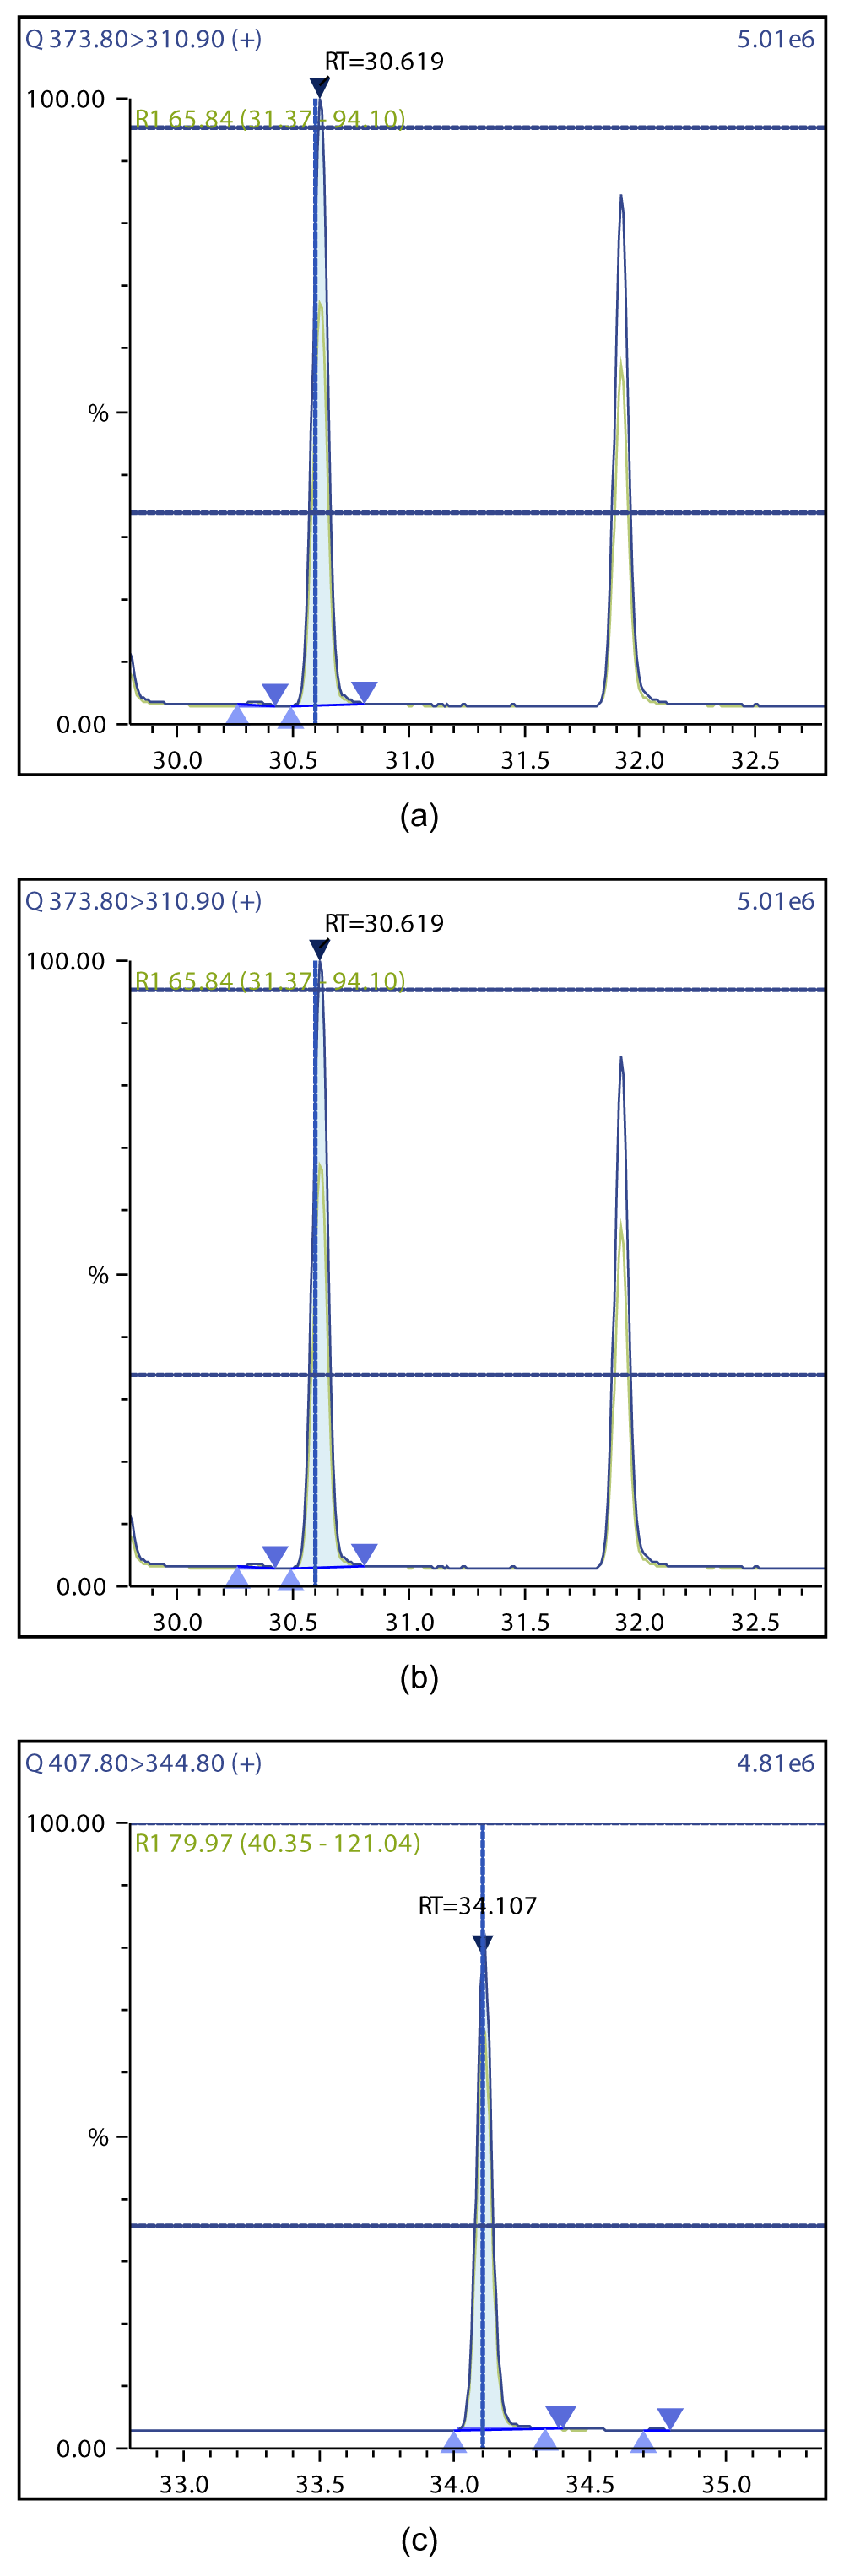
Figure 7: Chromatographic Profiles of HpDFs and OCDF: (a, b) HpDF (c) OCDF.
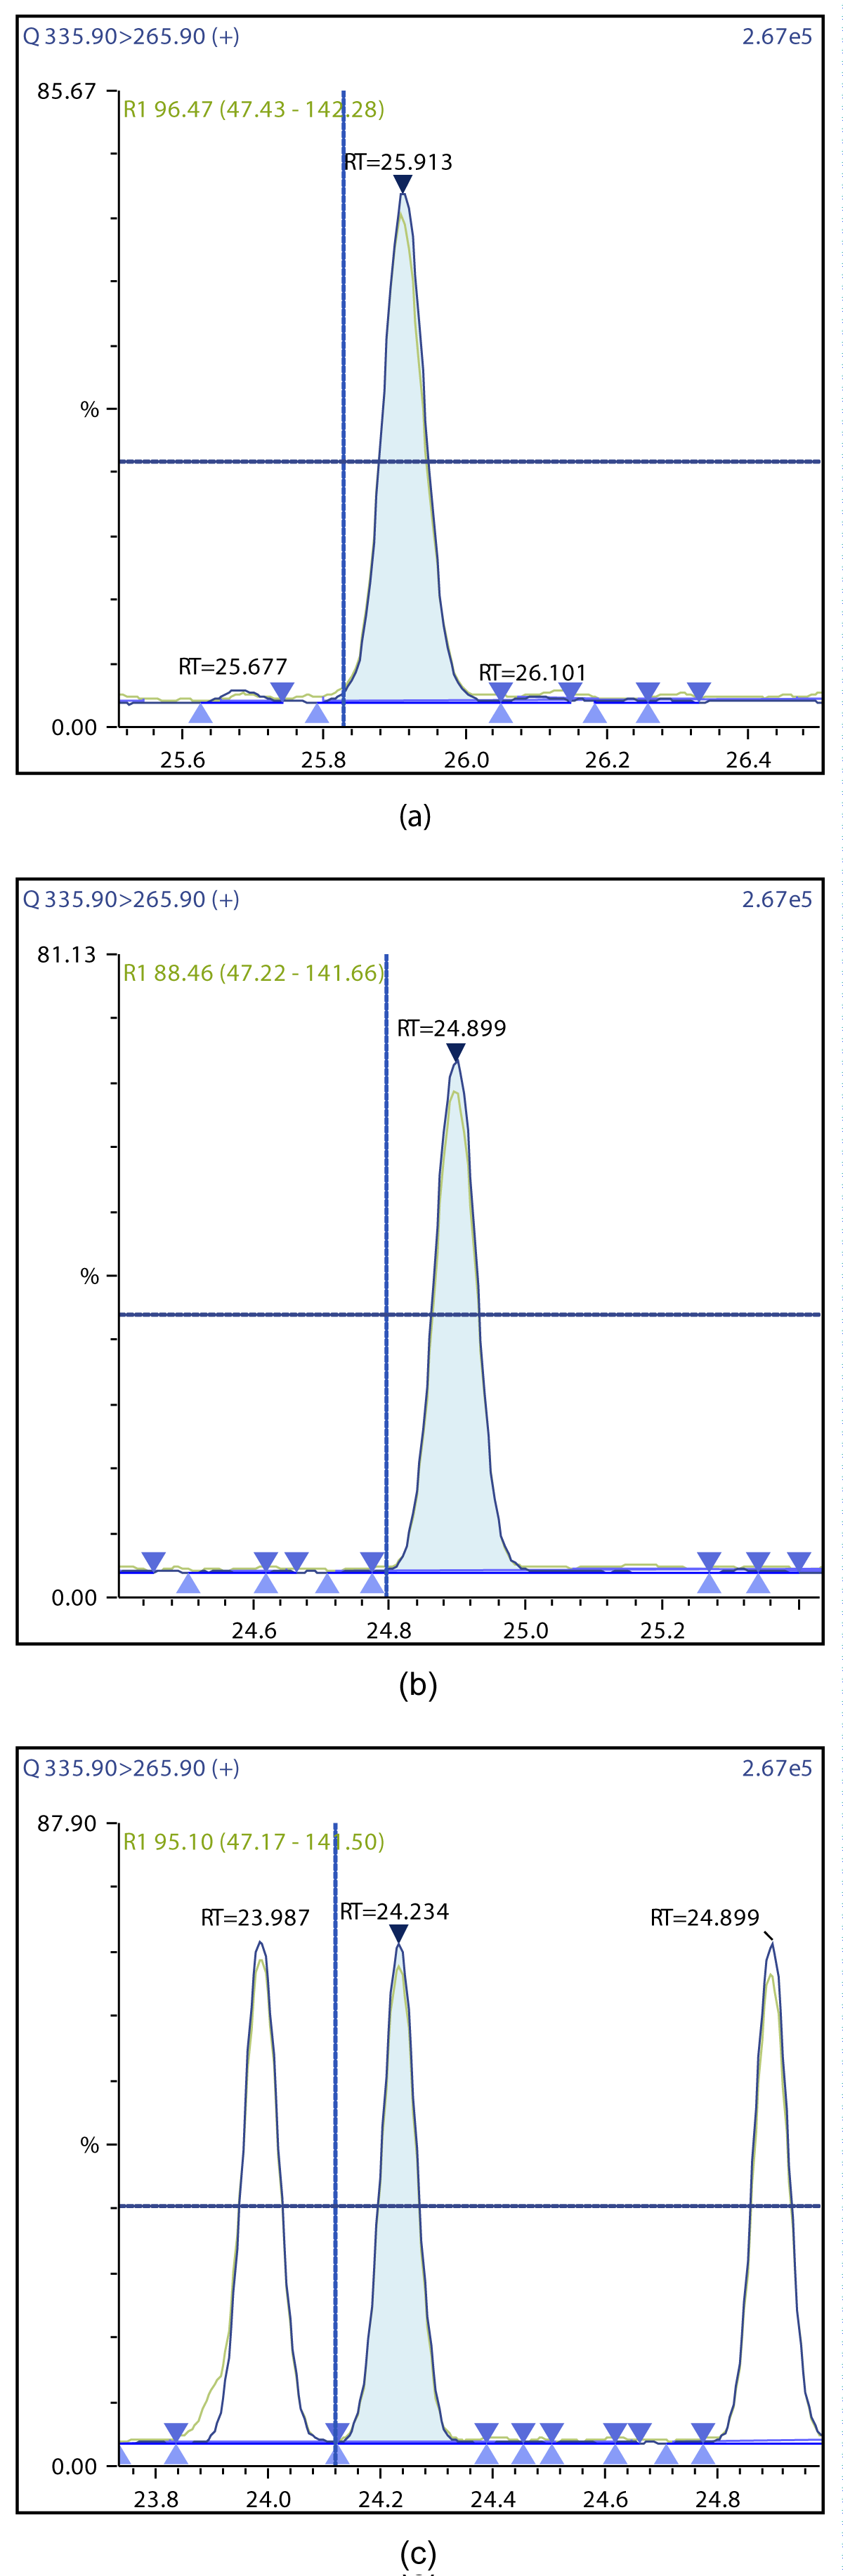
Figure 8: Chromatographic Profiles of DL-PCBs: (a) PCB 105 (b) PCB 114 (c) PCB 118.
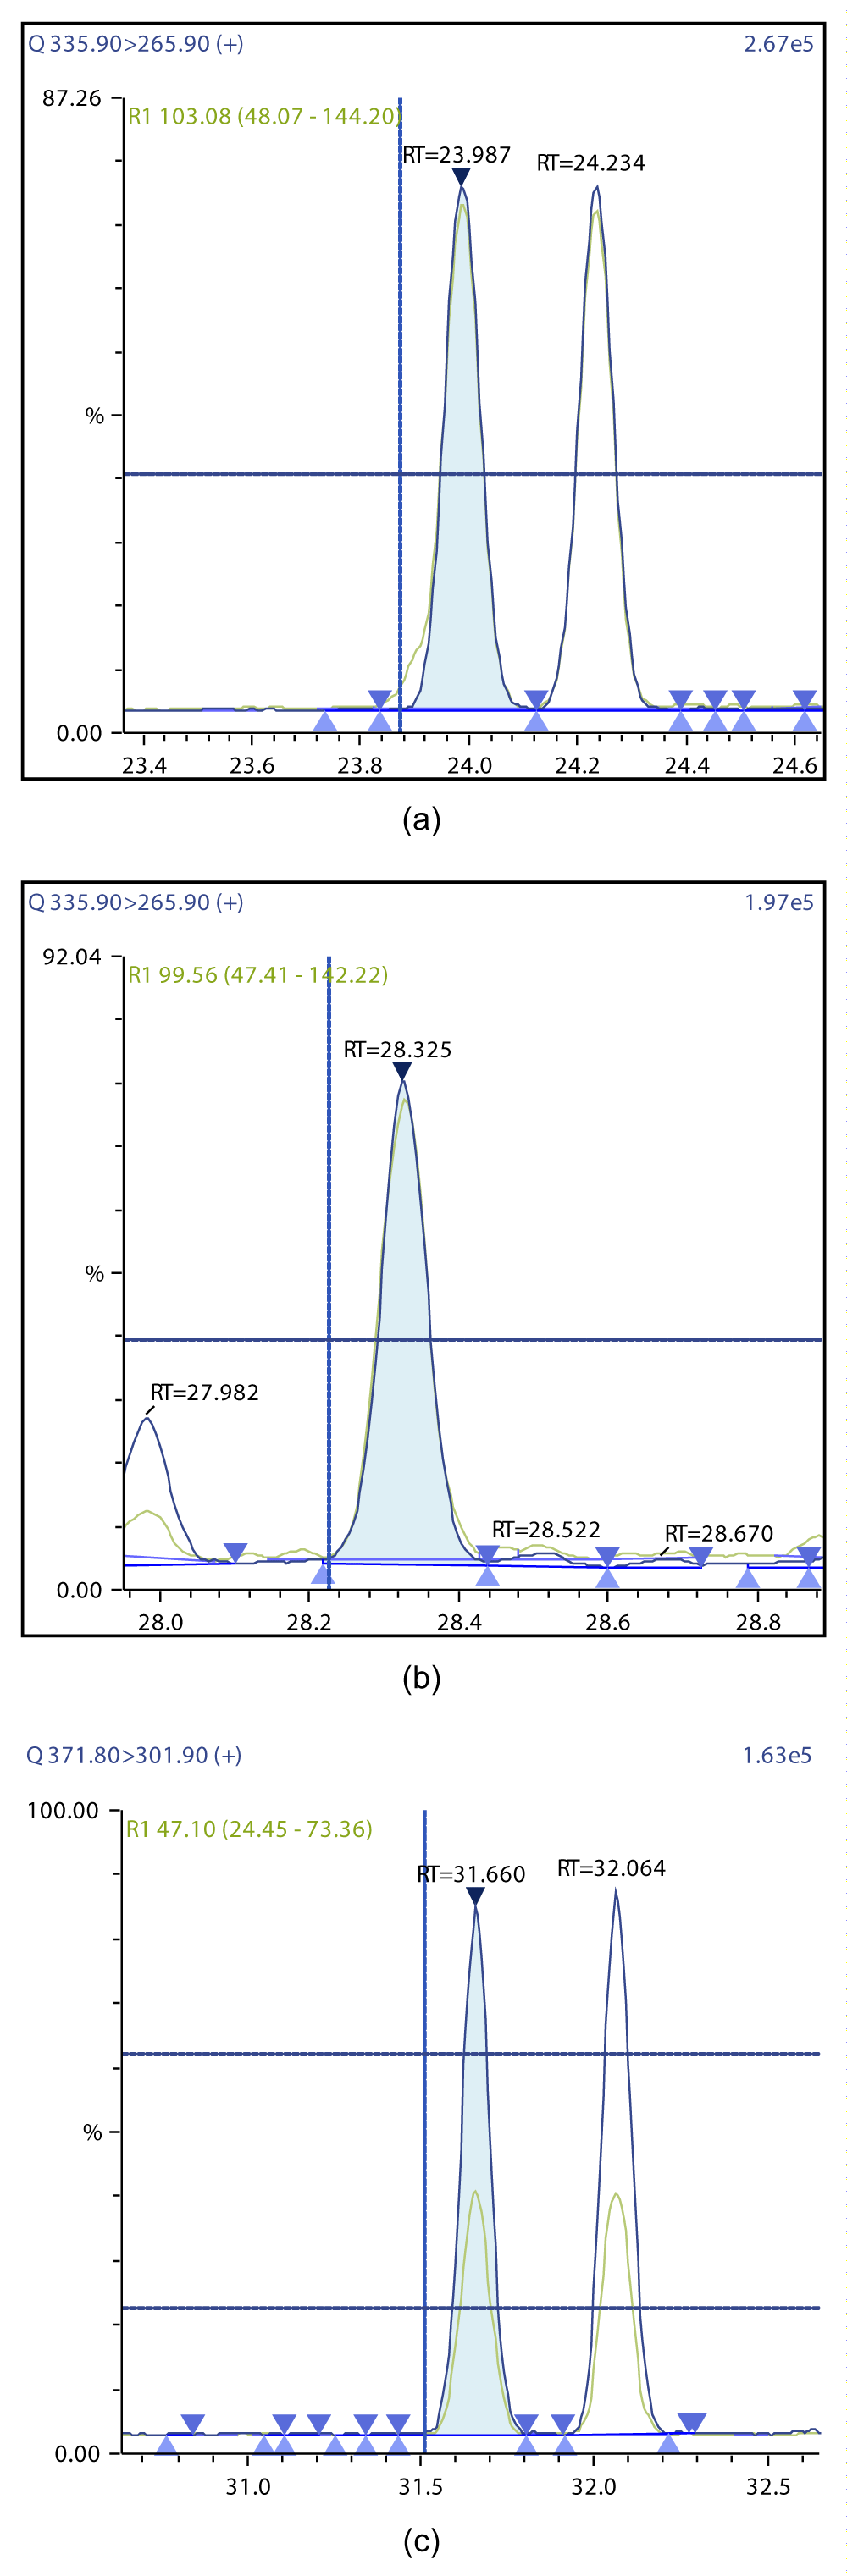
Figure 9: Chromatographic Profiles of DL-PCBs: (a) PCB 123 (b) PCB 126 (c) PCB 156, PCB 157.

Figure 10: Chromatographic Profiles of DL-PCBs: (a) PCB 167 (b) PCB 169 (c) PCB 180.
Instrumentation and measurements
A Shimadzu GC 8000 series gas chromatograph equipped with a triple quadrupole mass detector TQ8050 was used. The MS analyzer was equipped with a BEIS ionization chamber. The injection volume was set to 2 µl for PCDDs/PCDFs and DL-PCBs.
Chromatographic separations of calibration standards and all extracts for PCDDs/PCDFs were performed on an SH Rxi-5Sil MS 60 m x 0.25 mm I. D. x 0.25 µm( Shimadzu, USA) using an injector temperature at 280 °C in splitless mode and oven temperature program starting at 150 °C (1 min), ramp at 200 °C /min until 220 °C, 20 °C /min until 260 °C (3 min), 50 °C /min until 320 °C (3.5 min) and total run of 47 min. The ion source temperature was set to 230 °C and the interface temperature was set to 300 °C. Helium (1.5 ml/min) was used as the carrier gas. The MS analyzer was operated in MRM mode, with collision energy and transitions listed in Table 1 for the determination of PCDDs/PCDFs [7].
| Table 1: PCDD/PCDF Masses and CE. | ||||
| Compound Name | Quantitative Ion | CE | Reference Ion | CE |
| 2,3,7,8 – TCDD | 319.9>256.9 | 20 | 321.9>258.9 | 20 |
| 1,2,3,7,8 –PCDD | 335.9>292.9 | 20 | 353.9>290.9 | 20 |
| 1,2,3,4,7,8 – HxDD | 389.8>326.9 | 22 | 391.8>328.9 | 22 |
| 1,2,3,6,7,8 – HxDD | 389.8>326.9 | 22 | 391.8>328.9 | 22 |
| 1,2,3,7,8,9 - HxDD | 389.8>326.9 | 22 | 391.8>328.9 | 22 |
| 1,2,3,4,6,7,8 - HpDD | 423.8>360.8 | 22 | 425.8>362.8 | 22 |
| OCDD | 457.7>394.7 | 22 | 459.7>396.7 | |
| 2,3,7,8 – TCDF | 303.9>240.9 | 28 | 305.9>242.9 | 28 |
| 1,2,3,7,8 – PCDF | 355.9>292.9 | 20 | 353.9>290.9 | 20 |
| 2,3,4,7,8 – PCDF | 339.9>276.9 | 30 | 337.9>274.9 | 30 |
| 1,2,3,4,7,8 – HxDF | 389.8>326.9 | 22 | 391.8>328.9 | 22 |
| 1,2,3,6,7,8 – HxDF | 373.8>310.9 | 30 | 375.8>312.9 | 30 |
| 2,3,4,6,7,8 - HxDF | 373.8>310.9 | 30 | 375.8>312.9 | 30 |
| 1,2,3,7,8,9 - HxDF | 373.8>310.9 | 30 | 375.8>312.9 | 30 |
| 1,2,3,4,6,8,9 - HpDF | 419.8>355.9 | 30 | 421.8>357.9 | 30 |
| 1,2,3,4,7,8,9 - HpDF | 407.8>344.8 | 30 | 409.8>346.8 | 30 |
| OCDF | 441.8>378.8 | 30 | 443.8>380.8 | 30 |
| 2,3,7,8 – TCDD( 13C12) | 315.9>251.9 | 28 | 317.9>253.9 | 28 |
| 1,2,3,7,8 –PCDD( 13C12) | 367.9>303.9 | 20 | 365.9>301.9 | 20 |
| 1,2,3,4,7,8 – HxDD( 13C12) | 401.8>337.9 | 22 | 399.9>335.9 | 22 |
| 1,2,3,6,7,8 – HxDD( 13C12) | 401.8>337.9 | 22 | 399.9>335.9 | 22 |
| 1,2,3,7,8,9 - HxDD( 13C12) | 401.8>337.9 | 22 | 399.9>335.9 | 22 |
| 1,2,3,4,6,7,8 - HpDD( 13C12) | 419.8>355.9 | 30 | 421.8>357.9 | 30 |
| OCDD (13C12) | 469.8>405.8 | 22 | 471.8>407.8 | 22 |
| 2,3,7,8 – TCDF( 13C12) ( 13C12) | 315.9>251.9 | 28 | 317.9>253.9 | 28 |
| 1,2,3,7,8 – PCDF( 13C12) ( 13C12) | 351.9>287.9 | 30 | 349.9>285.9 | 30 |
| 2,3,4,7,8 – PCDF( 13C12) | 351.9>287.9 | 30 | 349.9>285.9 | 30 |
| 1,2,3,4,7,8 – HxDF( 13C12) | 385.8>321.9 | 30 | 387.8>323.9 | 30 |
| 1,2,3,6,7,8 – HxDF( 13C12) | 385.8>321.9 | 30 | 387.8>323.9 | 30 |
| 2,3,4,6,7,8 - HxDF( 13C12) | 373.8>310.9 | 30 | 375.8>312.9 | 30 |
| 1,2,3,7,8,9 - HxDF( 13C12) | 385.8>321.9 | 30 | 387.8>323.9 | 30 |
| 1,2,3,4,6,8,9 - HpDF( 13C12) | 419.8>355.9 | 30 | 421.8>357.9 | 30 |
| 1,2,3,4,7,8,9 - HpDF( 13C12) | 419.8>355.9 | 30 | 421.8>357.9 | 30 |
| OCDF( 13C12) | 453.8>389.8 | 30 | 455.8>391.8 | 30 |
Separations of DL-PCBs were performed on the same column, the injector was set to 250 °C and using different oven temperature programs starting at 120 °C (1 min), ramp at 20 °C /min until 180 °C, 5 °C /min until 200 °C, 2 °C /min until 240 °C (10 min), 2 °C /min until 290 °C (5 min) and total run of 68 min. The ion source temperature was set to 230 °C and the interface temperature was set to 300 °C. Helium (2.15 ml/min) was used as the carrier gas [8,9]. The MS analyzer was operated in MRM mode, with collision energy and transitions listed in Table 2 for the determination of DL-PCBs.
| Table 2: PCBs Masses and CE. | ||||
| Compounds Name | Quantitative Ion | CE | Reference Ion | CE |
| PCB 77 | 289.9>219.9 | 26 | 291.9>221.9 | 26 |
| PCB 81 | 289.9>219.9 | 26 | 291.9>221.9 | 26 |
| PCB 105 | 323.9>253.9 | 26 | 325.9>255.9 | 26 |
| PCB 114 | 323.9>253.9 | 26 | 325.9>255.9 | 26 |
| PCB 118 | 323.9>253.9 | 26 | 325.9>255.9 | 26 |
| PCB 123 | 323.9>253.9 | 26 | 325.9>255.9 | 26 |
| PCB 126 | 323.9>253.9 | 26 | 325.9>255.9 | 26 |
| PCB 156 | 359.9>289.9 | 28 | 361.9>291.9 | 28 |
| PCB 157 | 359.9>289.9 | 28 | 361.9>291.9 | 28 |
| PCB 167 | 359.9>289.9 | 28 | 361.9>291.9 | 28 |
| PCB 169 | 359.9>289.9 | 28 | 361.9>291.9 | 28 |
| PCB 189 | 393.8>323.9 | 28 | 395.8>325.9 | 28 |
| 13C12 - PCB 77 | 301.9>231.9 | 26 | 303.9>233.9 | 26 |
| 13C12 - PCB 81 | 301.9>231.9 | 26 | 303.9>233.9 | 26 |
| 13C12 - PCB 105 | 335.9>265.9 | 26 | 337.9>267.9 | 26 |
| 13C12 - PCB 114 | 335.9>265.9 | 26 | 337.9>267.9 | 26 |
| 13C12 - PCB 118 | 335.9>265.9 | 26 | 337.9>267.9 | 26 |
| 13C12 - PCB 123 | 335.9>265.9 | 26 | 337.9>267.9 | 26 |
| 13C12 - PCB 126 | 335.9>265.9 | 26 | 337.9>267.9 | 26 |
| 13C12 - PCB 156 | 371.8>301.9 | 28 | 373.8>303.9 | 28 |
| 13C12 - PCB 157 | 371.8>301.9 | 28 | 373.8>303.9 | 28 |
| 13C12 - PCB 167 | 371.8>301.9 | 28 | 373.8>303.9 | 28 |
| 13C12 - PCB 169 | 371.8>301.9 | 28 | 373.8>303.9 | 28 |
| 13C12 - PCB 189 | 405.8>323.9 | 28 | 395.8>325.9 | 28 |
The GC/MS/MS system was calibrated for PCDD. PCDF using response factors generated from anine–point curve at the level concentrations presented in Table 3 and Table 4.
| Table 3: Calibration solutions [CS] of PCDD/PCDF (ng/ml). | |||||||||
| Analyte | Calibration levels | ||||||||
| Native standard | CS1 | CS2 | CS3 | CS4 | CS5 | CS6 | CS7 | CS8 | CS9 |
| 2,3,7,8 - TCDD | 0.025 | 0.05 | 0.1 | 0.5 | 2 | 5 | 10 | 20 | 50 |
| 2,3,7,8 - ТCDF | 0.025 | 0.05 | 0.1 | 0.5 | 2 | 5 | 10 | 20 | 50 |
| 1,2,3,7,8 - PCDD | 0.025 | 0.05 | 0.1 | 0.5 | 2 | 5 | 10 | 20 | 50 |
| 1,2,3,7,8 - PCDF | 0.025 | 0.05 | 0.1 | 0.5 | 2 | 5 | 10 | 20 | 50 |
| 2,3,4,7,8 - PCDF | 0.025 | 0.05 | 0.1 | 0.5 | 2 | 5 | 10 | 20 | 50 |
| 1,2,3,4,7,8 - HXDF | 0.05 | 0.1 | 0.2 | 1 | 4 | 10 | 20 | 40 | 100 |
| 1,2,3,6,7,8 - HXDF | 0.05 | 0.1 | 0.2 | 1 | 4 | 10 | 20 | 40 | 100 |
| 2,3,4,6,7,8 - HXDF | 0.05 | 0.1 | 0.2 | 1 | 4 | 10 | 20 | 40 | 100 |
| 1,2,3,4,7,8 - HXDD | 0.05 | 0.1 | 0.2 | 1 | 4 | 10 | 20 | 40 | 100 |
| 1,2,3,6,7,8 - HXDD | 0.05 | 0.1 | 0.2 | 1 | 4 | 10 | 20 | 40 | 100 |
| 1,2,3,7,8,9 - HXDD | 0.05 | 0.1 | 0.2 | 1 | 4 | 10 | 20 | 40 | 100 |
| 1,2,3,7,8,9 - HXDF | 0.05 | 0.1 | 0.2 | 1 | 4 | 10 | 20 | 40 | 100 |
| 1,2,3,4,6,7,8 - HPDF | 0.05 | 0.1 | 0.2 | 1 | 4 | 10 | 20 | 40 | 100 |
| 1,2,3,4,6,7,8 - HPDD | 0.05 | 0.1 | 0.2 | 1 | 4 | 10 | 20 | 40 | 100 |
| 1,2,3,4,7,8,9 - HPDF | 0.05 | 0.1 | 0.2 | 1 | 4 | 10 | 20 | 40 | 100 |
| OCDD | 0.1 | 0.2 | 0.4 | 2 | 8 | 20 | 40 | 80 | 200 |
| OCDF | 0.1 | 0.2 | 0.4 | 2 | 8 | 20 | 40 | 80 | 200 |
| Internal standards | |||||||||
| 13С12 - 2,3,7,8 - TCDD | 2 | 2 | 2 | 2 | 2 | 2 | 2 | 2 | 2 |
| 13С12 - 2,3,7,8 - ТCDF | 2 | 2 | 2 | 2 | 2 | 2 | 2 | 2 | 2 |
| 13С12 - 1,2,3,7,8 - PCDD | 2 | 2 | 2 | 2 | 2 | 2 | 2 | 2 | 2 |
| 13С12 - 1,2,3,7,8 - P CDF | 2 | 2 | 2 | 2 | 2 | 2 | 2 | 2 | 2 |
| 13С12 - 2,3,4,7,8 - PCDF | 2 | 2 | 2 | 2 | 2 | 2 | 2 | 2 | 2 |
| 13С12 - 1,2,3,4,7,8 - HXDF | 2 | 2 | 2 | 2 | 2 | 2 | 2 | 2 | 2 |
| 13С12 - 1,2,3,6,7,8 - HXDF | 2 | 2 | 2 | 2 | 2 | 2 | 2 | 2 | 2 |
| 13С12 - 2,3,4,6,7,8 - HXDF | 2 | 2 | 2 | 2 | 2 | 2 | 2 | 2 | 2 |
| 13С12 - 1,2,3,4,7,8 - HXDD | 2 | 2 | 2 | 2 | 2 | 2 | 2 | 2 | 2 |
| 13С12 - 1,2,3,6,7,8 - HXDD | 2 | 2 | 2 | 2 | 2 | 2 | 2 | 2 | 2 |
| 13С12 - 1,2,3,7,8,9 - HXDD | 2 | 2 | 2 | 2 | 2 | 2 | 2 | 2 | 2 |
| 13С12 - 1,2,3,7,8,9 - HXDF | 2 | 2 | 2 | 2 | 2 | 2 | 2 | 2 | 2 |
| 13С12 - 1,2,3,4,6,7,8 - HPDF | 2 | 2 | 2 | 2 | 2 | 2 | 2 | 2 | 2 |
| 13С12 - 1,2,3,4,6,7,8 - HPDD | 2 | 2 | 2 | 2 | 2 | 2 | 2 | 2 | 2 |
| 13С12 - 1,2,3,4,7,8,9 - HPDF | 2 | 2 | 2 | 2 | 2 | 2 | 2 | 2 | 2 |
| 13С12 – OCDD | 4 | 4 | 4 | 4 | 4 | 4 | 4 | 4 | 4 |
| 13С12 - OCDF | 4 | 4 | 4 | 4 | 4 | 4 | 4 | 4 | 4 |
| Recovery standards | |||||||||
| 13С12 - 1,2,3,4 - TCDD | 2 | 2 | 2 | 2 | 2 | 2 | 2 | 2 | 2 |
| 13С12 -12,3,4,6,9 - HXDF | 2 | 2 | 2 | 2 | 2 | 2 | 2 | 2 | 2 |
| 13С12 -1,2,3,4,6,8,9 - HPDF | 2 | 2 | 2 | 2 | 2 | 2 | 2 | 2 | 2 |
| Table 4: Calibration solutions [CS] of DL-PCBs (ng/ml). | ||||||||
| Analyte | Calibration levels | |||||||
| Native standard | CS1 | CS2 | CS3 | CS4 | CS5 | CS6 | CS7 | CS8 |
| PCB 77 | 0.2 | 0.5 | 1 | 2 | 5 | 10 | 20 | 50 |
| PCB 81 | 0.2 | 0.5 | 1 | 2 | 5 | 10 | 20 | 50 |
| PCB 105 | 0.2 | 0.5 | 1 | 2 | 5 | 10 | 20 | 50 |
| PCB 114 | 0.2 | 0.5 | 1 | 2 | 5 | 10 | 20 | 50 |
| PCB 118 | 0.2 | 0.5 | 1 | 2 | 5 | 10 | 20 | 50 |
| PCB 123 | 0.2 | 0.5 | 1 | 2 | 5 | 10 | 20 | 50 |
| PCB 126 | 0.2 | 0.5 | 1 | 2 | 5 | 10 | 20 | 50 |
| PCB 156 | 0.2 | 0.5 | 1 | 2 | 5 | 10 | 20 | 50 |
| PCB 157 | 0.2 | 0.5 | 1 | 2 | 5 | 10 | 20 | 50 |
| PCB 167 | 0.2 | 0.5 | 1 | 2 | 5 | 10 | 20 | 50 |
| PCB 169 | 0.2 | 0.5 | 1 | 2 | 5 | 10 | 20 | 50 |
| PCB 189 | 0.2 | 0.5 | 1 | 2 | 5 | 10 | 20 | 50 |
| Internal Standard | ||||||||
| 13C12 - PCB 77 | 1 | 1 | 1 | 1 | 1 | 1 | 1 | 1 |
| 13C12 - PCB 81 | 1 | 1 | 1 | 1 | 1 | 1 | 1 | 1 |
| 13C12 - PCB 105 | 1 | 1 | 1 | 1 | 1 | 1 | 1 | 1 |
| 13C12 - PCB 114 | 1 | 1 | 1 | 1 | 1 | 1 | 1 | 1 |
| 13C12 - PCB 118 | 1 | 1 | 1 | 1 | 1 | 1 | 1 | 1 |
| 13C12 - PCB 123 | 1 | 1 | 1 | 1 | 1 | 1 | 1 | 1 |
| 13C12 - PCB 126 | 1 | 1 | 1 | 1 | 1 | 1 | 1 | 1 |
| 13C12 - PCB 156 | 1 | 1 | 1 | 1 | 1 | 1 | 1 | 1 |
| 13C12 - PCB 157 | 1 | 1 | 1 | 1 | 1 | 1 | 1 | 1 |
| 13C12 - PCB 167 | 1 | 1 | 1 | 1 | 1 | 1 | 1 | 1 |
| 13C12 - PCB 169 | 1 | 1 | 1 | 1 | 1 | 1 | 1 | 1 |
| 13C12 - PCB 189 | 1 | 1 | 1 | 1 | 1 | 1 | 1 | 1 |
GC/MS/MS calibration and analyte identification
The concentration of all congeners was determined using a nine-point calibration curve(standard solutions CS1 to CS9 as indicated in Table 3) for PCDDs/PCDFs and a seven-point calibration curve(standard mixture CS1 to CS7 as indicated in Table 4) for DL-PCBs. Calculation of relative response factors for native congeners was calculated using the following formula:
Where:
A1, A2 = areas of the two native congener diagnostic ions (Tables 1 and 2)
AIS1, AIS2 = areas of the two internal standard diagnostic ions (Tables 1 and 2)
Q = concentration of corresponding native congener, ng/ml
QIS = concentration of internal standard relevant to native congener, ng/ml
Next, the same procedure was applied to the calculation of the relative response factor for the internal standards using the appropriate recovery standards using the following formula:
Where:
Arec1, Arec2 = areas of the two recovery standard diagnostic ions
Qrec = concentration of corresponding recovery standard, ng/ml
The limit of detection (LOQ) is not a constant value, it depends on dilutions, the weight of the samples, analyte recovery and the sum of all congeners shall be about one-fifth of the maximum level [3].
Because S/N (signal/noise) ratio is too small we choose the lowest concentration point on a calibration curve approach for the determination of iLOQ. The LOQ is calculated from the lowest concentration point taking into account the recovery of internal standards added and the sample intake (Table 5).
| Table 5: Ion Ratio of native congeners and ISTD recoveries, LOQs values of calculated on the basis of lowest calibration level. | |||||
| Congener Name | Ret. TIme | TEF | ISTD Recovery | UB WHO TEQ | MB WHO TEQ |
| 2,3,7,8 - TCDD | 20.01 | 1 | 1.160 | 0.0200 | 0.0100 |
| 2,3,7,8-ТCDF | 19.40 | 0.1 | 1.007 | 0.0020 | 0.0010 |
| 1,2,3,7,8-PCDD | 25.34 | 1 | 0.857 | 0.0400 | 0.020 |
| 1,2,3,7,8-PCDF | 23.70 | 0.03 | 1.257 | 0.0012 | 0.0006 |
| 2,3,4,7,8-PCDF | 24.90 | 0.3 | 1.200 | 0.0012 | 0.0006 |
| 1,2,3,4,7,8-HXDF | 29.54 | 0.1 | 0.983 | 0.0080 | 0.0040 |
| 1,2,3,6,7,8-HXDF | 29.74 | 0.1 | 1.041 | 0.0080 | 0.0040 |
| 2,3,4,6,7,8-HXDF | 30.60 | 0.1 | 1.000 | 0.0060 | 0.0030 |
| 1,2,3,4,7,8-HXDD | 30.88 | 0.1 | 0.646 | 0.0012 | 0.0006 |
| 1,2,3,6,7,8-HXDD | 31.00 | 0.1 | 0.774 | 0.0060 | 0.0030 |
| 1,2,3,7,8,9-HXDD | 31.46 | 0.1 | 0.631 | 0.0080 | 0.0040 |
| 1,2,3,7,8,9-HXDF | 31.90 | 0.1 | 0.749 | 0.0080 | 0.0040 |
| 1,2,3,4,6,7,8-HPDF | 34.10 | 0.01 | 0.952 | 0.0040 | 0.0020 |
| 1,2,3,4,6,7,8-HPDD | 35.58 | 0.01 | 0.719 | 0.0010 | 0.0005 |
| 1,2,3,4,7,8,9-HPDF | 36.20 | 0.01 | 0.791 | 0.0040 | 0.0020 |
| OCDD | 39.19 | 0.0003 | 0.719 | 0.00003 | 0.00002 |
| OCDF | 39.38 | 0.0003 | 1.011 | 0.00002 | 0.00001 |
| PCB 77 | 22.52 | 0.0001 | 0.846 | 0.000017 | 0.000008 |
| PCB 81 | 21.86 | 0.0003 | 0.835 | 0.000047 | 0.000002 |
| PCB 123 | 23.89 | 0.00003 | 0.687 | 0.000003 | 0.000001 |
| PCB 118 | 24.14 | 0.00003 | 0.812 | 0.000002 | 0.000001 |
| PCB 114 | 24.81 | 0.00003 | 0.768 | 0.000004 | 0.000002 |
| PCB 105 | 25.85 | 0.00003 | 0.770 | 0.000004 | 0.000002 |
| PCB 126 | 28.24 | 0.1 | 1.041 | 0.02012 | 0.01006 |
| PCB 167 | 29.69 | 0.00003 | 1.011 | 0.000006 | 0.000003 |
| PCB 156 | 31.53 | 0.00003 | 0.932 | 0.000005 | 0.000002 |
| PCB 157 | 31.95 | 0.00003 | 0.978 | 0.000005 | 0.000002 |
| PCB 169 | 35.33 | 0.03 | 0.914 | 0.004578 | 0.002289 |
| PCB 189 | 39.60 | 0.00003 | 1.135 | 0.000006 | 0.000003 |
Calibration
Figures 5 and 6 show example mass chromatograms for each reference standard and negative samples for all test analytes. Calibration standards (seven levels for PCDD/Fs and seven levels for DL-PCBs) were analyzed for three analytical sequences and demonstrated good RF%RSDs within EU regulations. Table 6 shows the data obtained for PCDD/Fs and dioxin-like PCBs.
| Table 6: Calibration data for PCDDs/PCDFs and DL-PCBs congeners. | |||||
| Peak Name | Retention Time (min) | Coefficient of Determination (R2) | RF RSD (%) | Mean RF (Slope) | Range (pg) |
| 2,3,7,8 - TCDD | 20.01 | 0.99914 | 2.33 | 2.19 | 0.025 – 50.00 |
| 2,3,7,8-ТCDF | 19.40 | 0.99940 | 1.85 | 2.21 | 0.025 – 50.00 |
| 1,2,3,7,8-PCDD | 25.34 | 0.99947 | 1.62 | 1.62 | 0.025 – 50.00 |
| 1,2,3,7,8-PCDF | 23.70 | 0.99924 | 2.05 | 2.05 | 0.025 – 50.00 |
| 2,3,4,7,8-PCDF | 24.90 | 0.99953 | 1.77 | 1.77 | 0.025 – 50.00 |
| 1,2,3,4,7,8-HXDF | 29.54 | 0.99953 | 1.83 | 1.83 | 0.050 – 100.00 |
| 1,2,3,6,7,8-HXDF | 29.74 | 0.99955 | 1.90 | 1.89 | 0.050 – 100.00 |
| 2,3,4,6,7,8-HXDF | 30.60 | 0.99960 | 1.51 | 1.51 | 0.050 – 100.00 |
| 1,2,3,4,7,8-HXDD | 30.88 | 0.99937 | 1.74 | 1.74 | 0.050 – 100.00 |
| 1,2,3,6,7,8-HXDD | 31.00 | 0.99947 | 1.64 | 1.64 | 0.050 – 100.00 |
| 1,2,3,7,8,9-HXDD | 31.46 | 0.99951 | 1.99 | 1.99 | 0.050 – 100.00 |
| 1,2,3,7,8,9-HXDF | 31.90 | 0.99940 | 1.81 | 1.81 | 0.050 – 100.00 |
| 1,2,3,4,6,7,8-HPDF | 34.10 | 0.99927 | 1.75 | 1.76 | 0.050 – 100.00 |
| 1,2,3,4,6,7,8-HPDD | 35.58 | 0.99958 | 2.01 | 2.01 | 0.050 – 100.00 |
| 1,2,3,4,7,8,9-HPDF | 36.20 | 0.99946 | 1.90 | 1.90 | 0.050 – 100.00 |
| OCDD | 39.19 | 0.99942 | 1.39 | 1.40 | 0.10 – 200.00 |
| OCDF | 39.38 | 0.99903 | 1.58 | 1.58 | 0.10 – 200.00 |
| PCB 77 | 22.52 | 0.99962 | 0.90 | 2.73 | 0.20 – 50.00 |
| PCB 81 | 21.86 | 0.99941 | 1.00 | 2.85 | 0.20 – 50.00 |
| PCB 123 | 23.89 | 0.99951 | 2.85 | 2.93 | 0.20 – 50.00 |
| PCB 118 | 24.14 | 0.99942 | 0.79 | 3.02 | 0.20 – 50.00 |
| PCB 114 | 24.81 | 0.99922 | 3.01 | 2.93 | 0.20 – 50.00 |
| PCB 105 | 25.85 | 0.99920 | 2.93 | 2.96 | 0.20 – 50.00 |
| PCB 126 | 28.24 | 0.99929 | 0.86 | 2.88 | 0.20 – 50.00 |
| PCB 167 | 29.69 | 0.99937 | 0.69 | 2.87 | 0.20 – 50.00 |
| PCB 156 | 31.53 | 0.99926 | 0.73 | 3.00 | 0.20 – 50.00 |
| PCB 157 | 31.95 | 0.99947 | 0.69 | 2.93 | 0.20 – 50.00 |
| PCB 169 | 35.33 | 0.99932 | 0.82 | 2.96 | 0.20 – 50.00 |
| PCB 189 | 39.60 | 0.99938 | 0.75 | 2.85 | 0.20 – 50.00 |
The Relative Response Factors (RRFs) were calculated at each concentration level and the linearity was estimated based on the RRF and the determination coefficient (R2). The accuracy and instrumental limit of quantification (iLOQ) were assessed for each congener. Accuracy was expressed in terms of bias% and mean squared error and it was measured in standard solutions [15]. The iLOQ was calculated at the lowest calibration point and set by 10 times the standard deviation using 10 replicate injections. Finally, precision was expressed as relative standard deviation (RSD%) for the calibration curve levels (n = 10 for the lowest calibration point).
The lowest acceptable calibration point was determined according to two criteria. First, the calculated RSDs of the lowest level for all congeners must be ≤ 15%. Second, the relative difference between the RRF average obtained for all levels and the RRF average obtained for the lowest level must be ≤ 30%, according to the regulation. As can be observed in Table 6, this criterion was met and linearity was acceptable within the calibration range. At this point, the lowest calibration level was used to determine the Iloq [10-12].
Reaching the level of interest
Each congener has a different strength of toxicity and is expressed as a Toxic Equivalent Factor (TEF). The TEF value of 2, 3, 7, 8-TCDD has values of 1, which is the most toxic congener.
All the regulated target compounds include the most toxic congeners of PCDD/Fs and DL-PCBs which have a toxic equivalent factor assigned by the World Health Organization (WHO) [1,6].
The maximum acceptable level for the PCDDs/PCDFs and DL-PCBs in foods and feeds is prescribed by their Toxic Equivalents (TEQ). The TEQ was calculated by multiplying the concentration of each compound by the TEF and then calculating the total TEQ for all congeners.
In this study, two types of vegetable oils (rapeseed and sunflower oil) and sunflower meal pellets were analyzed using GC/MS/MS. The LOQ of each individual congener was calculated from the lowest concentration point (CS1) taking into account the recovery of internal standards (60% - 120%) and in abundance.
Quantification of PCDD/PCDFs and DL-PCBs in sample extracts
Following successful validation of the method, the corresponding congeners were quantified in the sample extracts. Excellent chromatographic separation with minimal matrix interference was observed for all labeled congeners in all sample extracts analyzed.
The Ion Ratio (IR) abundance for selected transitions of each of PCDD/PCDFs and DL-PCBs congeners was measured in each of the samples analyzed and the values were compared with measured ion ratio values (average from the calibration standards CS1-CS9). The results of this study show that all the IR for the analyzed compounds were within the 15% tolerance, meeting the EU criteria for dioxin confirmation [2] (Figures 11-18).
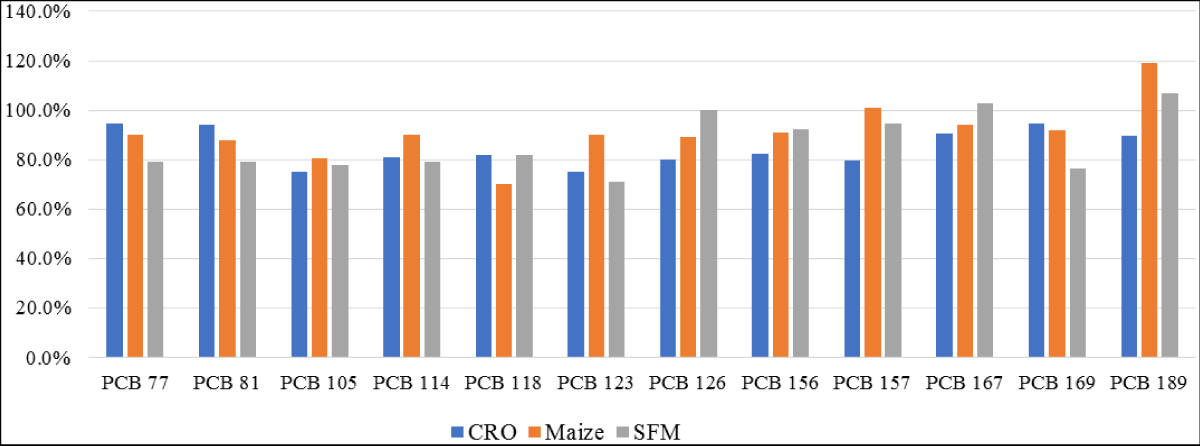
Figure 11: PCDD/PCDFs data for sunflower feed meal (SFM), crude sunflower oil (CSO) and crude rapeseed oil (CRO).
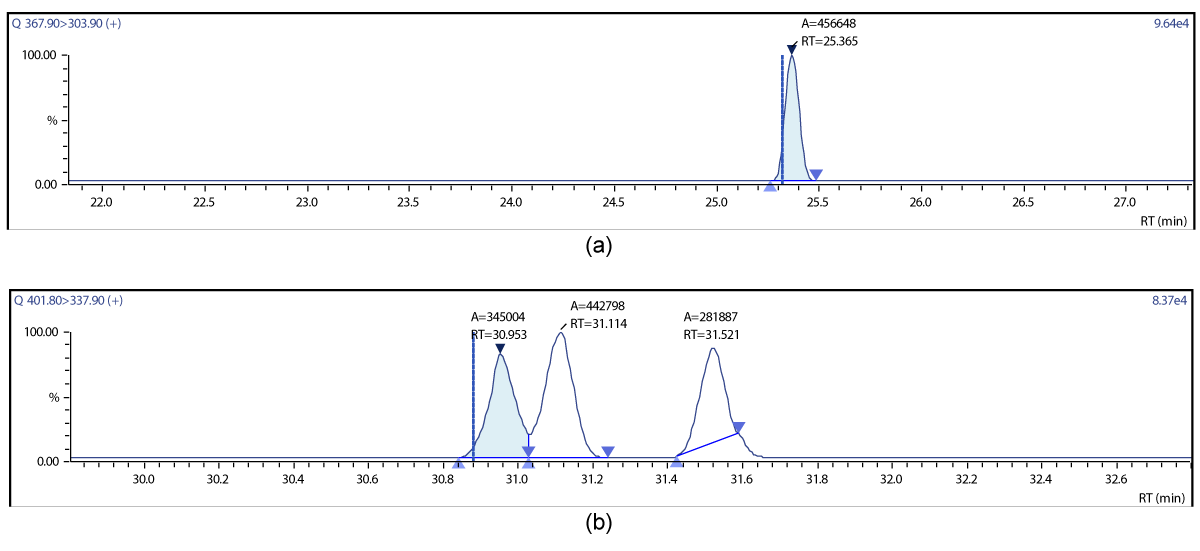
Figure 12: Chromatographic Profiles of PCDD/PCDFs in maize extract: (a) TCDD (b) HxDD.
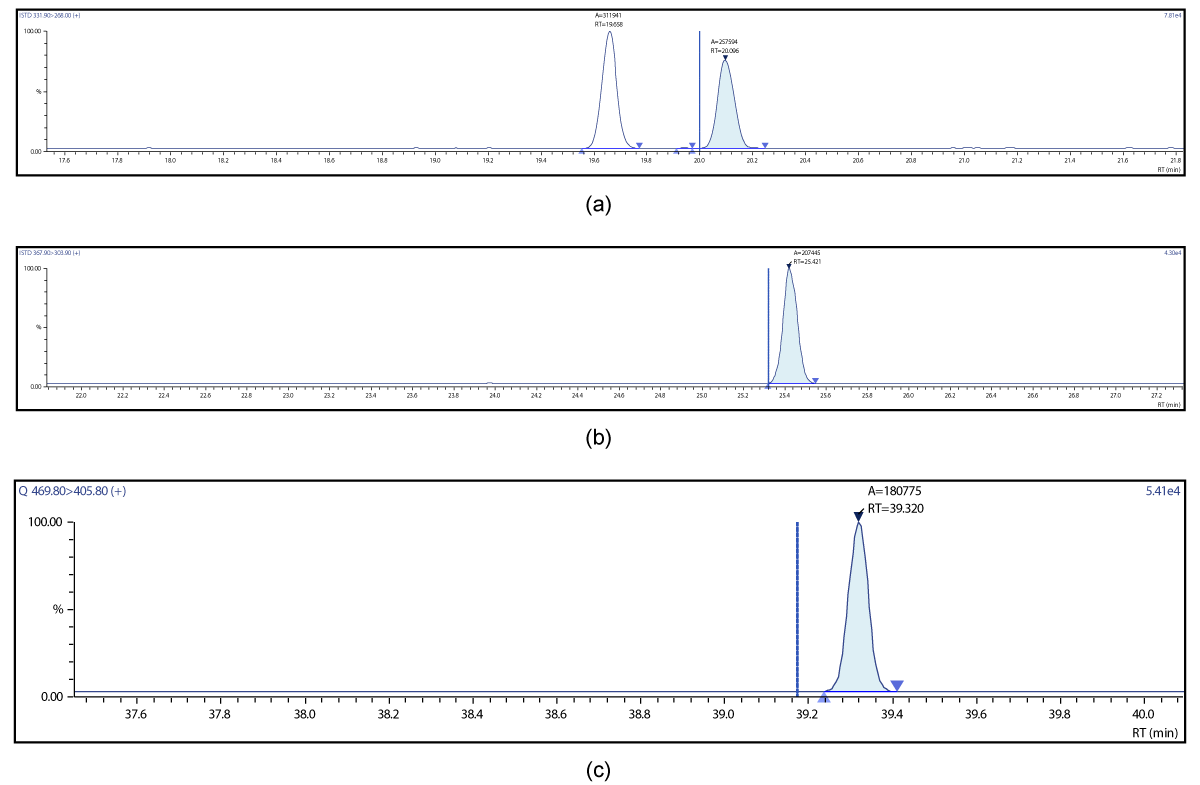
Figure 13: Chromatographic Profiles of PCDD/PCDFs in crude sunflower oil: (a) TCDD (b) PCDD (c) OCDD.
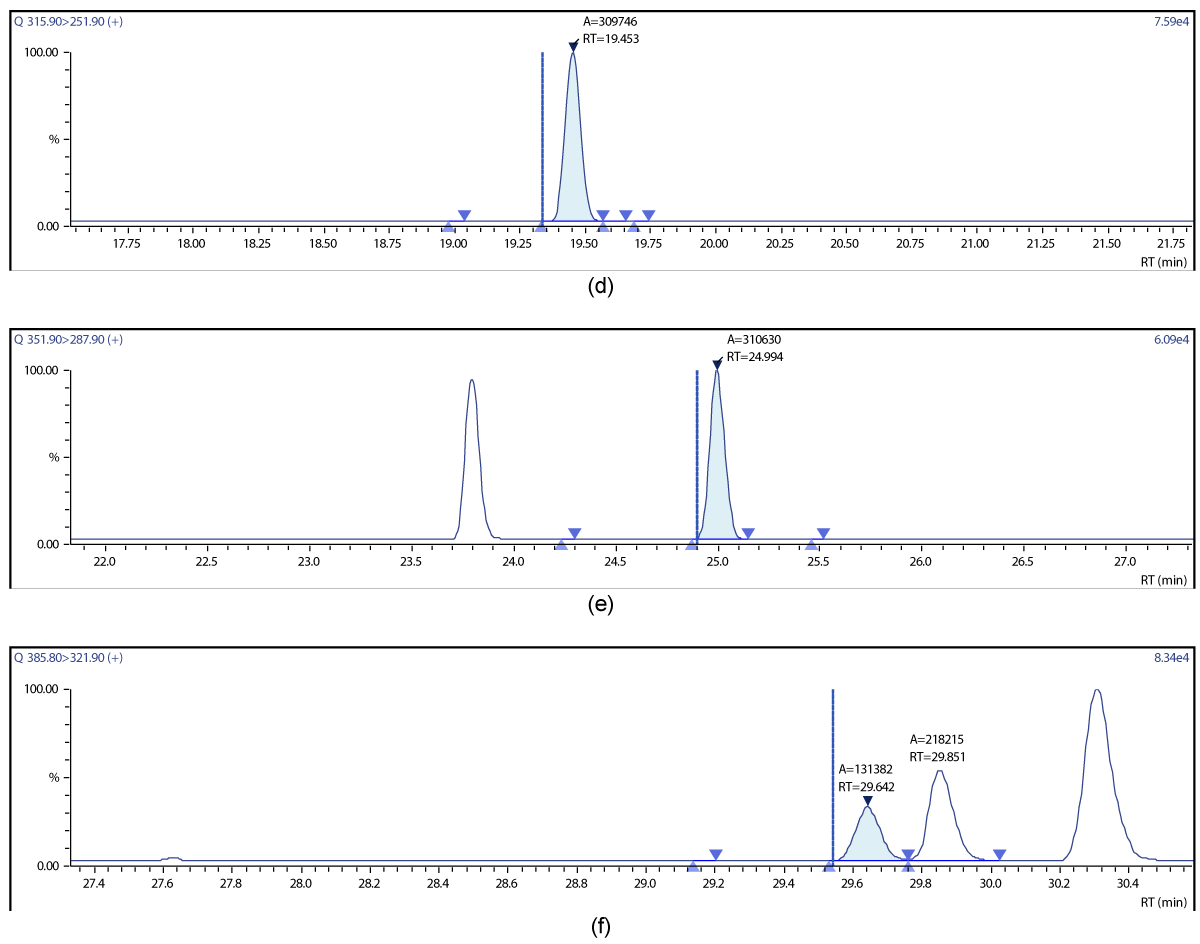
Figure 14: Chromatographic Profiles of PCDD/PCDFs in crude sunflower oil: (d) TCDF (e) PCDF (f) HxDF.
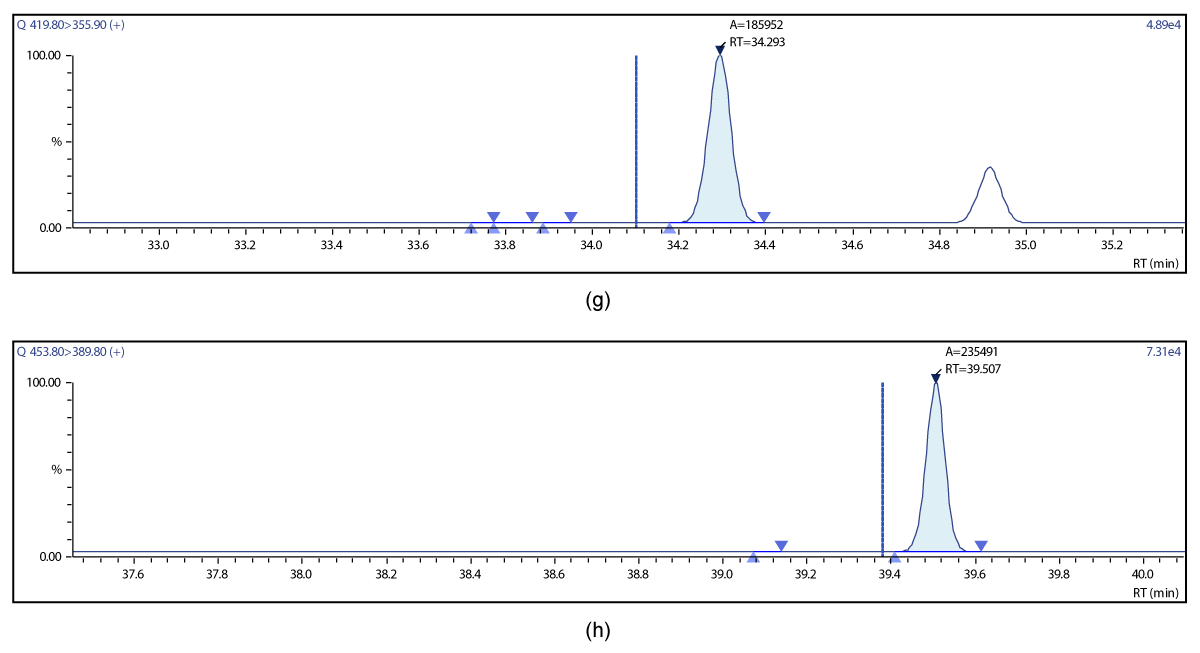
Figure 15: Chromatographic Profiles of PCDD/PCDFs in crude sunflower oil: (g) HpDF (h) OCDF.
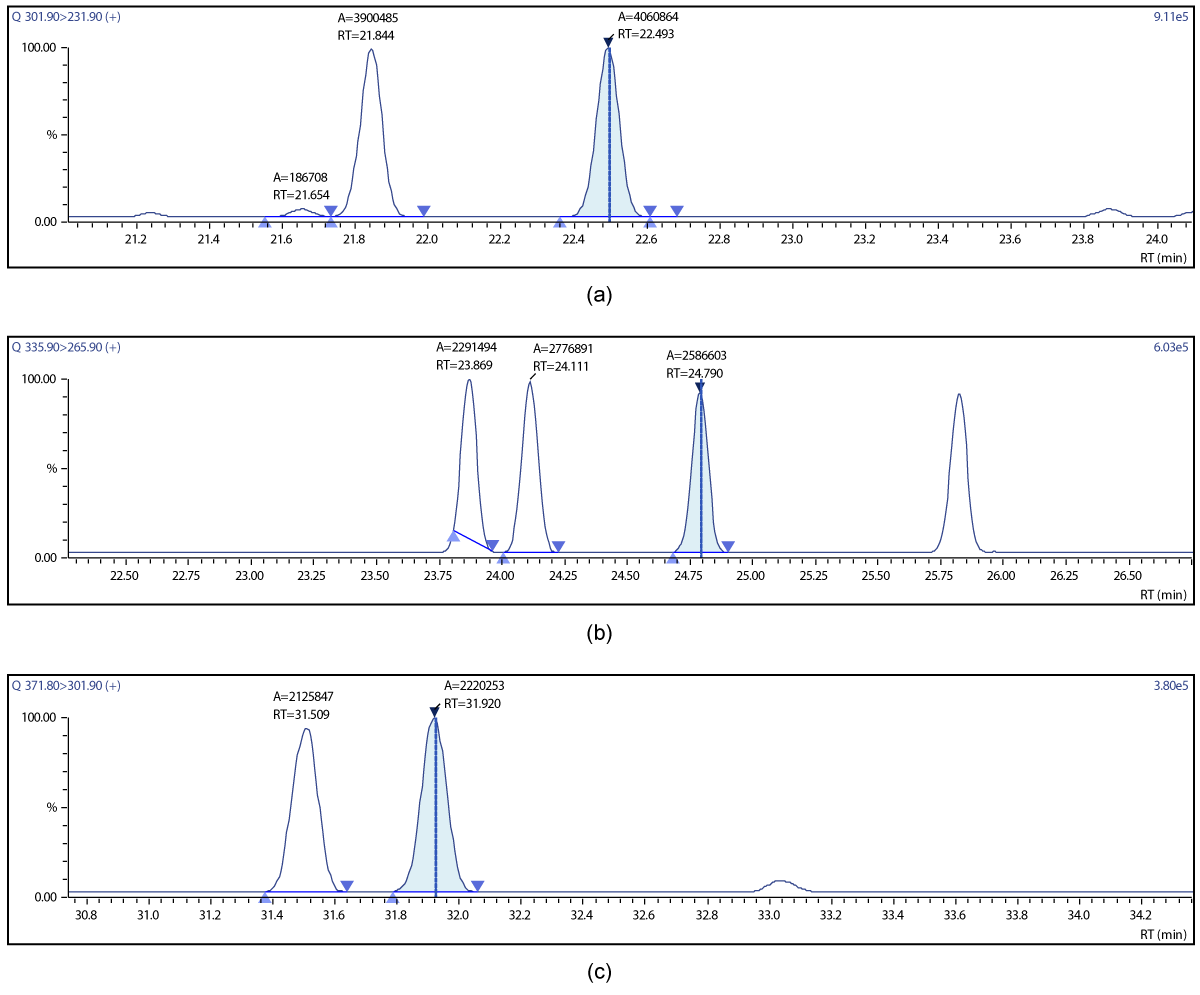
Figure 16: Chromatographic Profiles of DL-PCBs in crude rapeseed oil: (a) PCB 77, PCB 81 (b) PCB 105,114,118,123; (c) PCB 156,157.
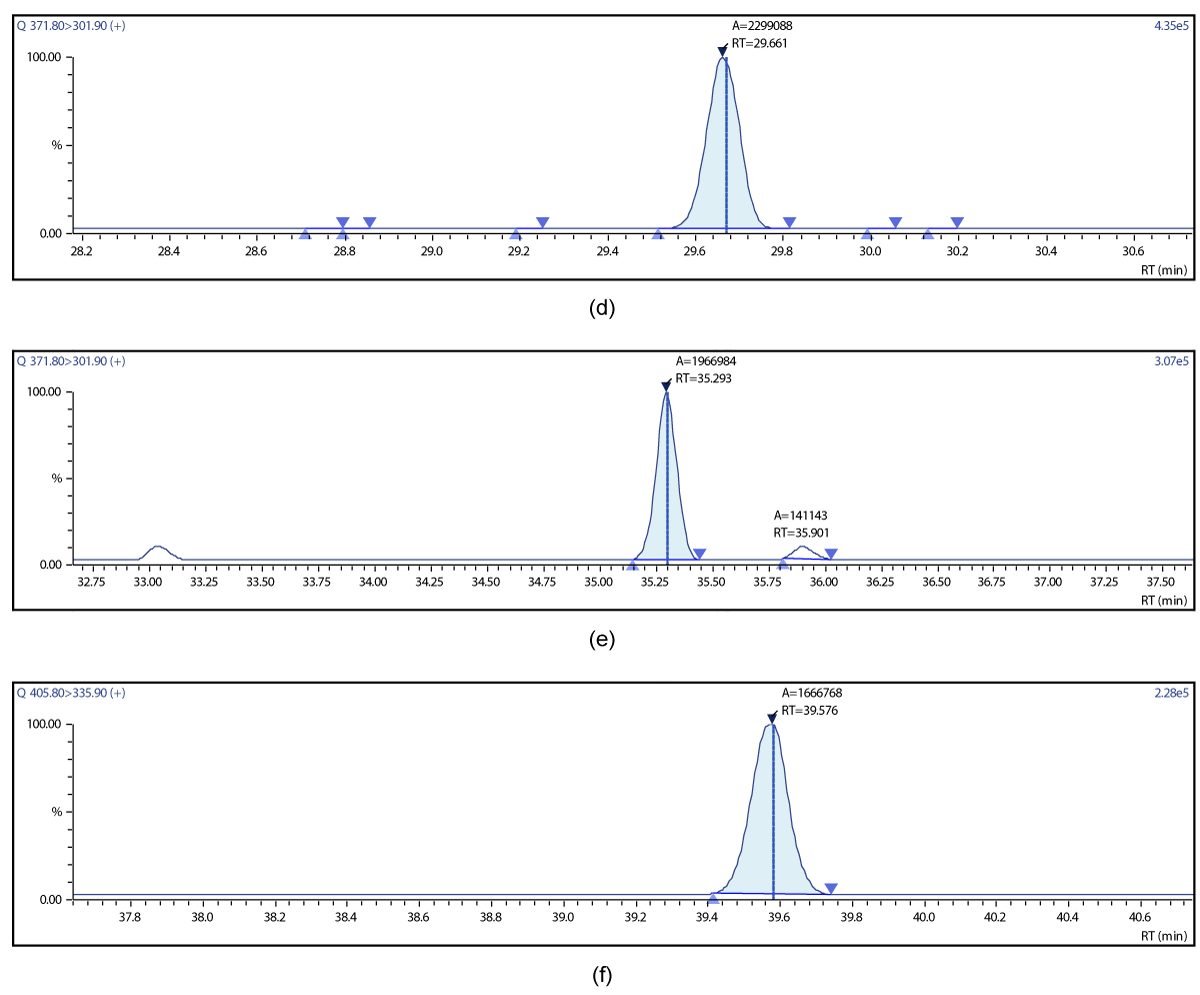
Figure 17: Chromatographic Profiles of DL-PCBs in crude rapeseed oil: (d) PCB 167 (e) PCB 169 (f) PCB 189.
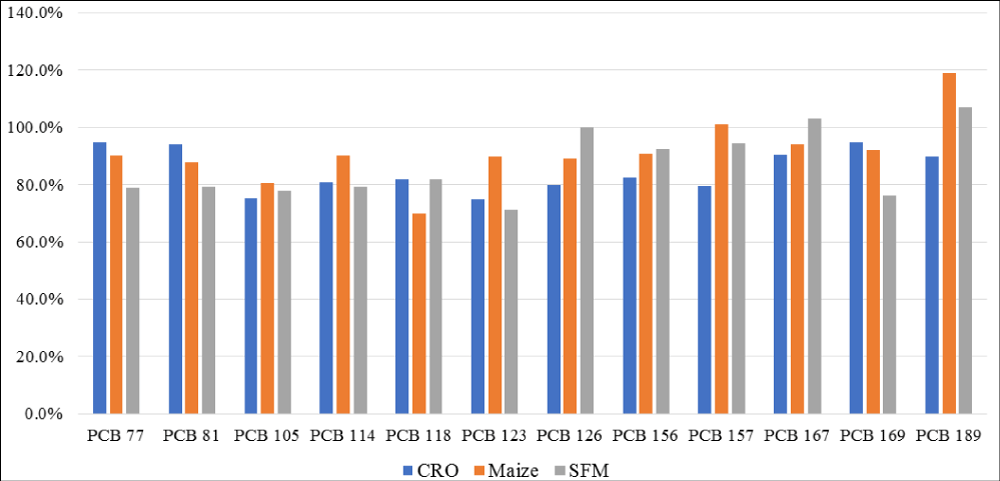
Figure 18: DL-PCBs data for sunflower feed meal (SFM), crude sunflower oil (CSO), and crude rapeseed oil (CRO).
The advantages of the new approach are obvious. Combination of short extraction time, use of small solvent volume, and high-performance clean-up strategy results in short delivery time and high-quality chromatograms which are easy to process.
The extraction of maize, wheat and sunflower meals starts with a sample intake of 10 grams and the required volume of organic solvent is 70 ml. The total extraction time required is approximately 1 hour. At the end of extraction time, the solvent is concentrated down to near dryness the final extract fat/oil and put directly on the clean-up column. After purification, the obtained two fractions are evaporated to 20 µl in a GC vial equipped with an insert and put directly in an auto-sampler [16].
In the case of vegetable oil, the samples were subjected to acid digestion before multilayer column cleanup and the remaining procedure was the same as mentioned above.
A GC/triple quadrupole MS/MS method has been developed and fully validated in accordance with criteria in EU Regulation 709/2014 that allows the use of GC/triple quadrupole MS/MS as a confirmatory method for the official control of PCDDs, PCDFs and DL-PCBs in animal feedstuffs and vegetable oils. This method meets the requirements of the regulation and can achieve similar performance to GC/HRMS.
The clear and confident detection of these congeners at very low levels, even within typically complex food and feed matrices, illustrates the high sensitivity of the method, as well as its high analytical value considering the extremely high toxicity of many dioxins.
Finally, the stability of the target ion ratios across the entire set of analyses – including a range of PCDD/PDFs and DL-PCBs concentrations and potential matrix effects – supports the utility and reliability of this method for high-confidence analyses to meet current regulatory demands.
- Van den Berg M, Birnbaum LS, Denison M, De Vito M, Farland W, Feeley M, Fiedler H, Hakansson H, Hanberg A, Haws L, Rose M, Safe S, Schrenk D, Tohyama C, Tritscher A, Tuomisto J, Tysklind M, Walker N, Peterson RE. The 2005 World Health Organization reevaluation of human and Mammalian toxic equivalency factors for dioxins and dioxin-like compounds. Toxicol Sci. 2006 Oct;93(2):223-41. doi: 10.1093/toxsci/kfl055. Epub 2006 Jul 7. PMID: 16829543; PMCID: PMC2290740.
- European Commission (EC). Commission Regulation No. 199/2006 of 3 February 2006 amending Regulation (EC) No 466/2001 setting maximum levels for certain contaminants in foodstuffs as regards dioxins and dioxin-like PCBs. Off J. 2006; L 32: 04/02/2006; 34-38.
- Ellison SLR, Rosslein M, Williams A. (eds). EURACHEM/CITAC Guide CG4: Quantifying uncertainty in analytical measurement, Second Ed. EURACHEM, QUAM: 2000; 1:120.
- Method 1613. Tetra-through Octa-Chlorinated Dioxins and Furans by Isotope Dilution HRGC/HRMS, Revision A. October 1993.
- Method 1668 Rev. A: Chlorinated biphenyl congeners in water, soil, sediment and tissue by HRGC/HRMS. USEPA, Washington DC.
- Furst P. Contribution of dioxin-like PCB to total toxic equivalents of dairy products. Organohalogen Compounds. 2001; 51: 279-282.
- Takakura M, Lehardy T, Marchard P. Analysis of Dioxins in Foods and Feeds Using GC-MS/MS, First Edition. July 2018.
- Hamm S, Grumping R, Shwietering J. Levels of polychlorinated dibenzo(p)dioxins, dibenzofurans and dioxin-like PCBs in milk, milk products and eggs from west European countries. Organohalogen Compounds. 2005; 60:199-202.
- Vestraete F. EU-strategy to reduce the presence of dioxins, furans and dioxin-like PCBs in feed and food-existing measures. Organohalogen Compounds. 2005; 67:1421-1423.
- De Greyt W, De Kock J, Kokken M, KellensM. Removal of Contaminants from edible oils:Current Status and Future Developments.Paper presented at the Lipidforum Seminar on Recent Developments in the Processing of Oils and Fats, Blue Lagoon, Iceland. September 28-20 2000.
- Van den Berg M, Birnbaum L, Bosveld AT, Brunström B, Cook P, Feeley M, Giesy JP, Hanberg A, Hasegawa R, Kennedy SW, Kubiak T, Larsen JC, van Leeuwen FX, Liem AK, Nolt C, Peterson RE, Poellinger L, Safe S, Schrenk D, Tillitt D, Tysklind M, Younes M, Waern F, Zacharewski T. Toxic equivalency factors (TEFs) for PCBs, PCDDs, PCDFs for humans and wildlife. Environ Health Perspect. 1998 Dec;106(12):775-92. doi: 10.1289/ehp.98106775. PMID: 9831538; PMCID: PMC1533232.
- Fiedler H, Cooper KR, Bergek S, Hjelt M, Rappe C. Polychlorinated dibenzo-p-dioxins and polychlorinated dibenzofurans (PCDD/PCDF) in food samples collected in southern Mississippi, USA. Chemosphere. 1997 Mar-Apr;34(5-7):1411-9. doi: 10.1016/s0045-6535(97)00438-4. PMID: 9134675.
- Ramos L, Eljarrat E, Hernández LM, Rivera J, González MJ. Levels of PCBs, PCDDs and PCDFs in commercial butter samples in Spain. Chemosphere. 1999 Jun;38(13):3141-53. doi: 10.1016/s0045-6535(98)00521-9. PMID: 10230050.
- Bosio A, Llobet, JM, Domingo JL, Casas C, Teixido A, Muller L. Levels of PCDD/PCDFs in food samples from Catalonia,Spain, Organohalogen Compounds. 2002; 57:105.
- EC Directive 2044/44/EC of 13 April 2004 amending Directive 2002/69/EC laying down the sampling methods and the methods of analysis for the official control of dioxins and the determination of dioxin-like PCBs in foodstuffs. OJEC L113/17.