
More Information
Submitted: March 06, 2023 | Approved: July 18, 2023 | Published: July 19, 2023
How to cite this article: Ogunkunle OA, Adeojo OD, Idowu OC. Water Purification Using Ceramic Pots Water Filter. Ann Adv Chem. 2023; 7: 057-063
DOI: 10.29328/journal.aac.1001044
Copyright License: © 2023 Ogunkunle OA, et al. This is an open access article distributed under the Creative Commons Attribution License, which permits unrestricted use, distribution, and reproduction in any medium, provided the original work is properly cited.
Keywords: Drinking water; Ceramic pot filters; Nanoparticles; Contaminants; Metals; Health

Water Purification Using Ceramic Pots Water Filter
Olaoluwa Ayobami Ogunkunle1*, Oluwamumiyo Dorcas Adeojo2 and Olamide Christianah Idowu1
1Department of Chemistry, Obafemi Awolowo University, Ile-Ife 220005, Nigeria
2Department of Chemistry, University of Ibadan, Nigeria
*Address for Correspondence: Olaoluwa Ayobami Ogunkunle, Department of Chemistry, Obafemi Awolowo University, Ile-Ife 220005, Nigeria, Email: [email protected]
In this study, ceramic pot filters are made from clay and burn-out materials (sawdust) that give pore sizes capable of capturing contaminants. Manufacturing specifications were selected to achieve some results. Clay and sawdust are mixed in a 50% volume ratio each and sawdust was subjected to hot water extraction to give a treated sample. Filters produced comprised of untreated, treated, and a mixture of treated and untreated sawdust samples, some of which were dipped in a solution of silver nanoparticles while others were not dipped (treated undipped, treated dipped, mixed dipped, mixed undipped, untreated undipped, untreated dipped). The effectiveness of the produced filters for the removal of contaminants such as dissolved solids, turbidity, and metals was tested using water collected from the Ikeji Arakeji River in Osun, Nigeria. The results showed the filter with treated sawdust undipped in a solution of silver nano gave the best result in the removal of the contaminants. Also, the filter with the mixtures of treated and untreated sawdust gave a better result compared to the standard. While the standard gave a better result than the untreated undipped ceramic filter pot. In conclusion, with proper cleaning and maintenance of the filters, they can effectively provide treated water suitable for drinking to rural people affected by polluted water sources.
The water crisis affects millions worldwide and it is expected to worsen over the coming years and decade. It was estimated that in 2010, 1.8 billion people consumed water deemed “unsafe” and 783 million regularly used water sources unprotected from contamination (USEPA, 2002) [1-3] Children are the most affected by ingestion of the contaminated water. Every year, 3.4 million children die as a result of diarrhea and other diseases caused by water-borne microbes making it the second leading cause of death of children, especially in low- and middle-income countries (Onda, et al. 2012; Wu, et al. 2011; Larson, et al. 2023) [4,5].
Though many factors contribute to water contamination, climate change, poor infrastructure, and failed aid projects continue to exacerbate the problem. Climate change often stresses water supplies in areas that are already water-scarce, forcing residents to use unsanitary sources [6,7]. The continued lack of sanitation infrastructure in many countries also leads to contamination of drinking water and affects health and development in these [8,9].
Water purification solutions must fulfill a variety of requirements in order to be successful. First and foremost, they must improve health by filtering out particulates as well as the majority of harmful microbes [10]. However, the technologies must accomplish this while ensuring that clean water is still affordable to those in extreme poverty. Additionally, technologies must be appropriate and applicable wherever water quality must be improved. Successful processes also should not further contribute to other health or environmental ailments such as fossil fuel pollution and the resultant respiratory illness. Both the filtration process and the consumable water must be socio-culturally acceptable to the users. For instance, operation and maintenance must be within local education levels and different–tasting water should need to be remedied or avoided. Finally, successful cleaning processes must resolve how to preserve sanitation while storing water (or how to clean only what is needed at the time (EPA, 2023) [11].
In the further pursuit of solutions to providing safe drinking water to those in need, point–of–use household water treatment has emerged as a complementary solution to centralized water supply systems [12]. Household ceramic water filters, in particular, offer an affordable and effective means of treating water to a standard suitable for drinking [13-15]. The present study is therefore aimed at developing ceramic filters using clay and sawdust as burnout materials for water treatment.
Sample collection and preparation
The fresh colloidal water used in the flow rate determination and other studies were collected at Ikeji Arakeji town in Oriade local government Area of Osun state, Nigeria, and the water is known to be consumed by a lot of worshippers because the source is located within a religious center.
The clay grogs were obtained in a mine site at Itori village Ewekoro local government Area of Ogun State, Nigeria. It appeared multicolored when freshly excavated. The appearance is because it is made of red and black clay mixture locally known as Iro and Ewuya respectively in the local dialect. This color difference shows that red clay is about 70% to 75% present in the mixture which made the sample suitable for use for ceramic water filters as a result of its high plasticity as compared to other types of clay (Figure 1). all the samples used in this study were readily available and accessible.
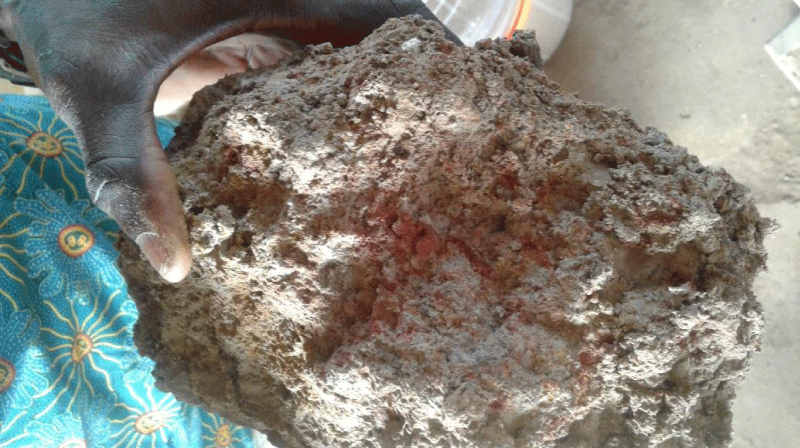
Figure 1: Experimental clay sample.
Pretreatment of clay sample
The clay grogs were reduced into smaller pieces and sun-dried for about four days under constant sunlight before it was further pulverized using mortar and pestle to a powdery state. The pulverized clay was sieved to 0.425 mm particle size (Figure 2), thoroughly agitated, and re-dried to ensure minimal moisture retention.
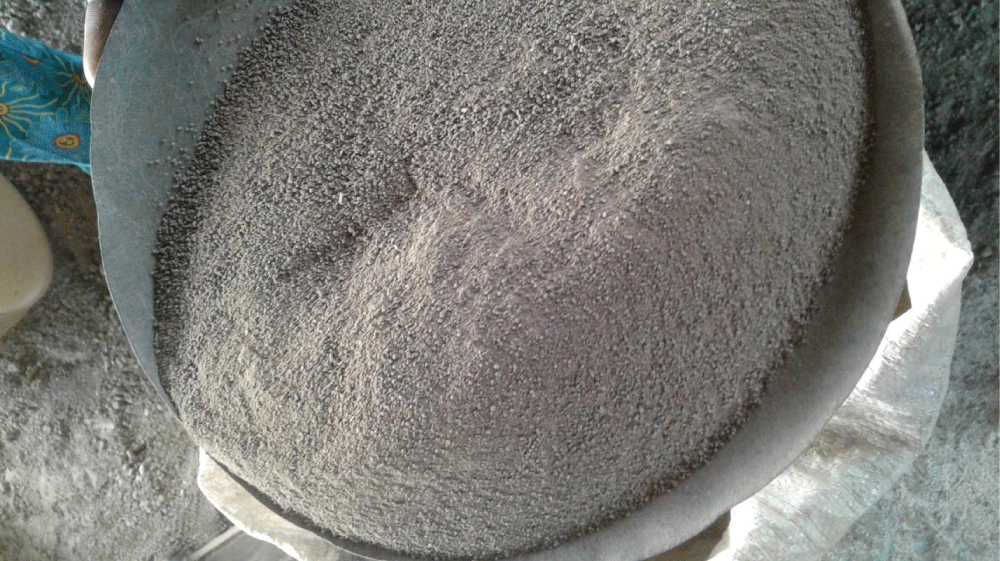
Figure 2: Pulverised and sieved clay sample.
Pretreatment of sawdust samples
The sawdust particles were washed continuously with hot water at about 80 oC for about 1 hour in a thermo-coupled voltage regulator-aided water bath. The sawdust was poured into different water baths filled with deionized water and stirred periodically for about an hour before they were drained of water and the extract was kept in a container for further analysis. The hot water-treated sawdust was sun-dried to a moisture content of about 12% before it was sieved to 2 mm particle size and packed in an airtight container (Figures 3a,b) to prevent further absorption of moisture and bacteria invasion.
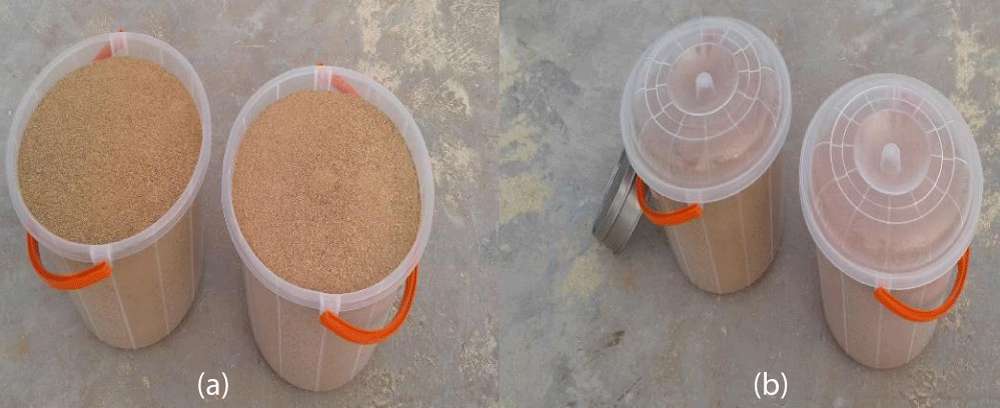
Figure 3: Pretreated sawdust samples; (a) Sieved sawdust; (b) Stored sawdust samples.
Phytochemical screening
The phytochemical screening to ascertain the presence of the polyphenolic compounds in the sawdust samples was carried out and described below.
Test for alkaloids: About 0.2 g of the extract was warmed with 2% H2SO4 for 2 minutes, it was filtered And a few drops of Dragendoff Reagent were added. The formation of an orange-red precipitate indicated the presence of alkaloids [16].
Test for glycosides: Extracts from the sawdust were shaken with deionized water and filtered. The filtrate was boiled with drops of Fehling’s solution A and B for two minutes. The presence of reducing sugar was indicated by the formation of an orange-red precipitate on boiling with Fehling’s solutions. The extracts were hydrolyzed with dilute HCl and neutralized with NaOH solution. A drop of Fehling’s solution A and B were added. Red precipitate indicated the presence of glycosides [17].
Test for saponins: About 0.2 g of the extracts were shaken with 5 cm3 of deionized water and then heated to a boil. Frothing showed the presence of Saponins [18].
Test for flavonoids: Small quantities of the extracts were dissolved in diluted NaOH and hydrochloric acid was added. A yellow solution that turned colorless indicated the presence of flavonoids [19].
Test for tannin: 1 g of the extract was mixed with 10 cm3 of water to make a decoction. 5% iron (III) chloride solution was added drop by drop to 2-3 cm3 extract. A blue-black color indicated the presence of tannin. The color produced is best detected by adding diluting 1 cm3 of the tannin extract in a test tube filled with deionized water and then adding FeCl3. [20].
Test for sterols: 0.5 g of the extract was dissolved in 2 cm3 of chloroform H2SO4 and was added carefully to form a lower layer. A reddish-brown interphase indicates the presence of sterols [17].
Production of ceramic water filter
The clay sample used in the ceramic water filter was dry-mixed with sawdust samples. The mixture was mixed based on a volume ratio of (1:1) of clay and sawdust respectively [21,22]. The mixture was further subjected to thorough sieving using a 1 mm pore-size mesh to ensure proper homogenous mixing before deionized water was added at intervals until the required plastic texture was obtained in the resulting matrix (Figure 4).
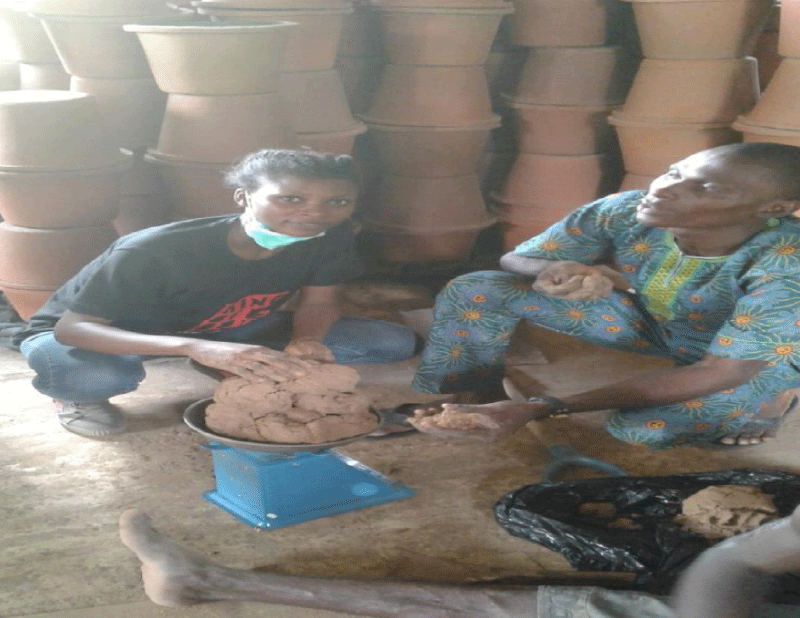
Figure 4: Weighing of the clay-sawdust matrix before molding.
The matrix was molded into a frustum shape using a press with appropriate pressure (Figure 5). Different productions of filters were carried out using the untreated and hot water pre-treated sawdust samples at different mixing ratios.
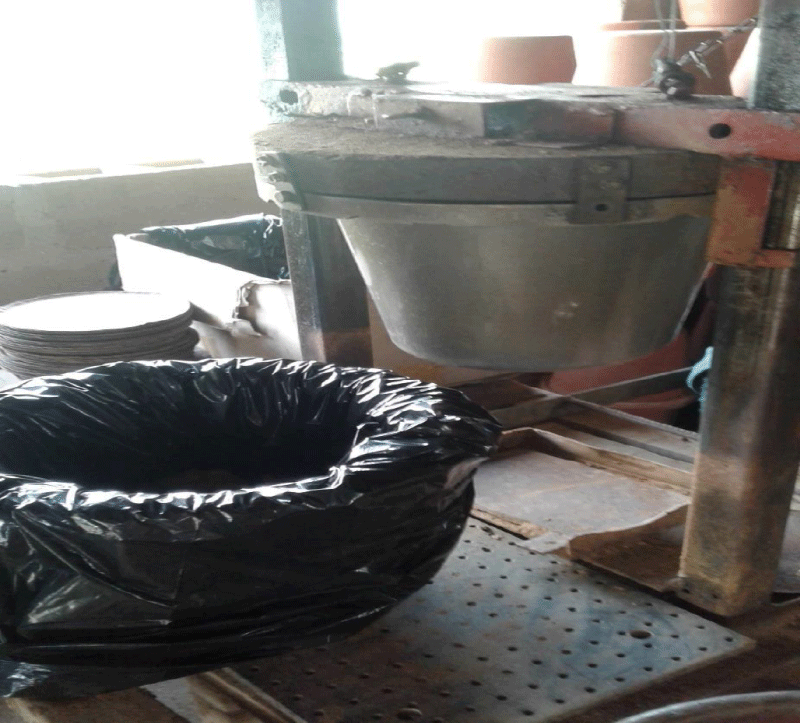
Figure 5: Molding press for the ceramic filter.
The molded frustum-shaped ceramic filters were air dried for two weeks at room temperature before they were arranged in a locally made clay kiln and fired, the temperature was maintained to 85 °C. This was done at a rate of 45 °C per hour and was further increased to 100 °C per hour with a gradual and steady increase in the temperature. During the heating process, the sawdust burnt off at a temperature of approximately 500 °C leaving behind micro pores in the filter. The variation in the temperature was measured using a type K thermocouple. The furnace was cooled to room temperature (Figure 6) and the fired filters were packed and aired at room temperature for a week.
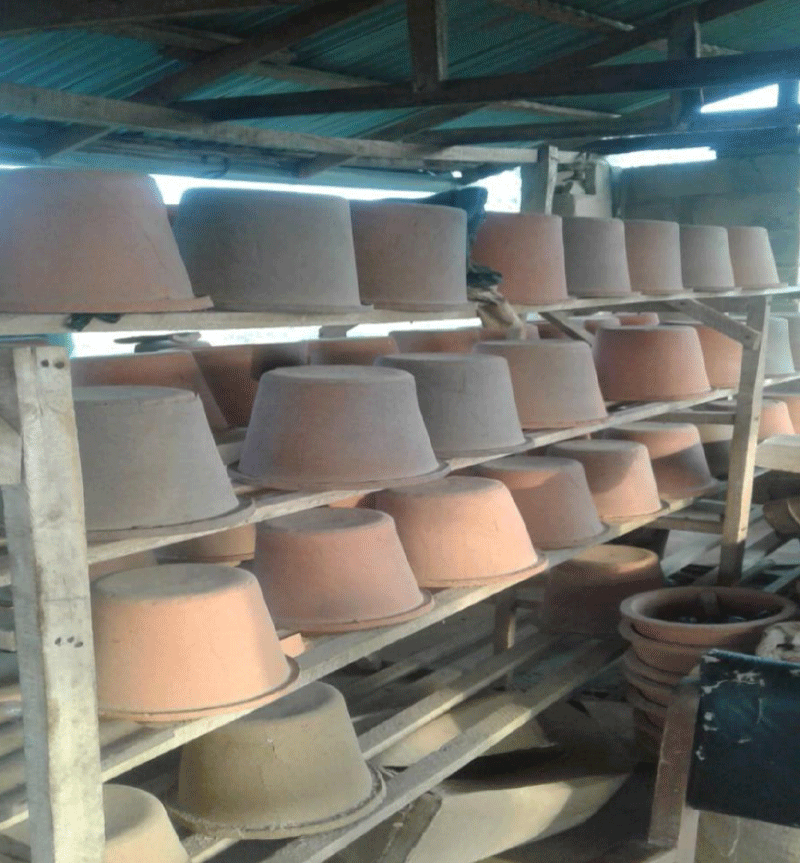
Figure 6: Sun-drying of ceramic filters.
Some of the ceramic filters were later impregnated with colloidal silver nanoparticles by dipping them in a solution of silver nanoparticles for disinfection purposes. The dipped filters were air-dried for another week before packaging.
Flow rate determination
Filters were soaked in deionized water for about 3 to 6 hours to ensure saturation before the flow rate determination. Flow rates were determined by pouring the collected colloidal water into the ceramic filter (Figure 7) and placing the filtering ceramics in a graduated glass container (Figure 8) the amount of water that filters through after each hour was measured and recorded.
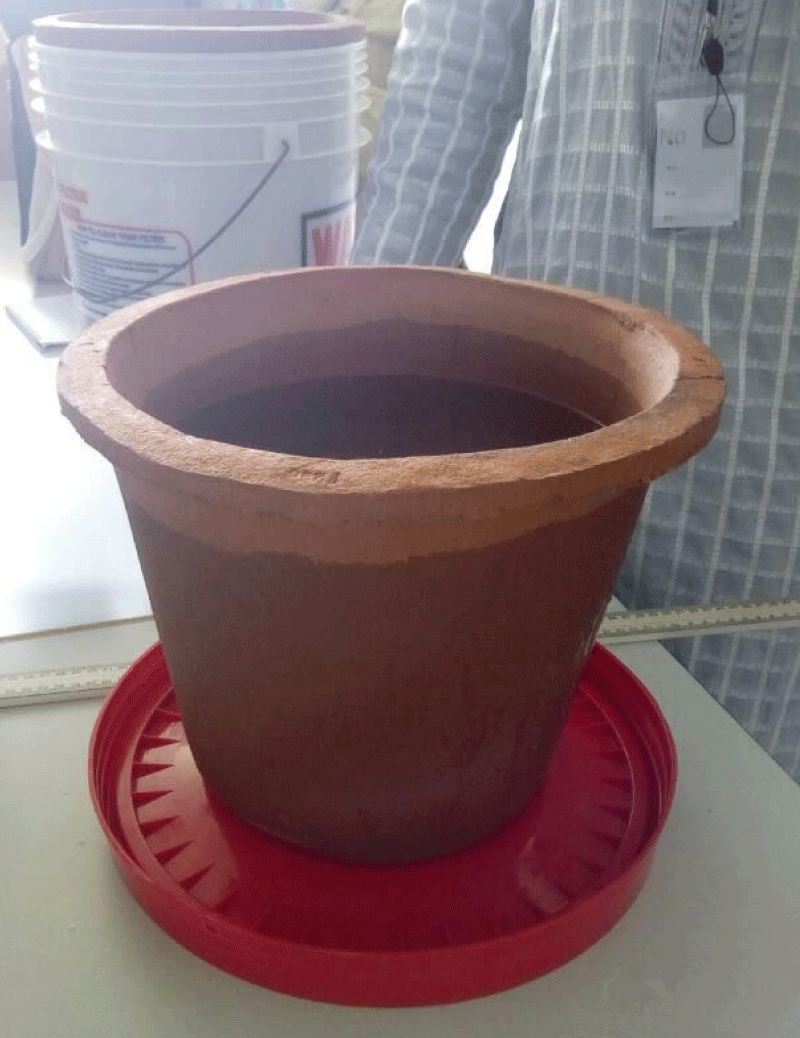
Figure 7: Water saturated ceramic filter just before filtration.
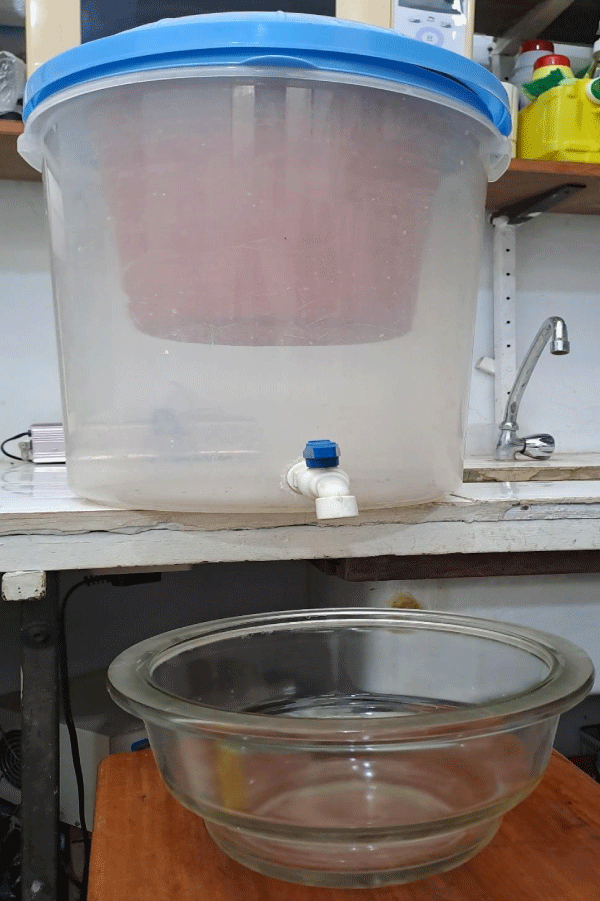
Figure 8: Experimental setup for water filtration.
Analyses of raw and filtered water samples
The following analyses were carried out on the raw and filtered water.
Elemental analysis: The raw and filtered water samples were analyzed for the presence of Zinc (Zn), Cadmium (Cd), Manganese (Mn), and Lead (Pb) using Atomic Absorption Spectroscopy (AAS) using the flames of each of these metals with detection limits of 0.01, 0.02, 0.01 and 0.02 mg/L respectively for each determined metal.
Turbidity test, Total Dissolved Solids (TDS), and pH determination: The turbidity test was carried out with the use of a turbidimetry meter to determine the clarity of water samples while the Total dissolved solid test that showed the level of the dissolved solids combining the organic and inorganic content in the water samples was also determined.
The pH of the various water samples in the study was determined after the calibration of the pH meter with standard buffers of 4, 7, and 10.
Phytochemical substances
The presence of phytochemical substances which are polyphenolic in nature, water, and alkali-soluble are known to inhibit the setting of composite and their removal or reduction in their concentration in constituting cellulosic materials facilitated the bonding compatibility to agricultural residues [23]. The hot water extraction removed most of these inhibitory substances thus enhancing the compatibility of the clay particles with the lignocellulosic particles [24]. The results showed a close similarity between the sawdust used as a standard and the one used in this study in the sense that the experimental sample sawdust was found to contain a relatively higher amount of these polyphenolic compounds as presented in Table 1 compared to the sawdust used in the standard that contained a lower amount of alkaloids but flavonoids were absent. Though these phytochemical substances are known for their medicinal properties in man, their presence in potable water can alter some of their properties such as pH, color, and taste. The hot water treatment can be said to be appropriate since it serves a dual purpose of removing substances that could inhibit the setting in the clay composite and also reduce the potability of the water.
| Table 1: Phytochemical Components in Sawdust. | ||
| Compound | Sawdust | |
| Standard | Experimental | |
| Tannins | − | − |
| Glycosides | − | − |
| Saponins | ++ | ++ |
| Flavonoids | _ | + |
| Steroids | − | − |
| Alkaloids | ++ | +++ |
Flow rate
With the sawdust used as the burnout material at the optimal performing form, the effluents obtained from the filtration processes ranged between 1 and 2 liters with the maximum effluent obtained being 1.70 liters obtained with the use of hot water treated sawdust sample (Table 2). It was observed that the flow rate was slow enough to allow adequate contaminants filtration and it was quick enough to supply adequate filtered water for drinking. After about three hours decrease in flow rate was observed due to a decrease in the level of influent water [25], indicating that the higher the quantity of the influent water, the higher the flow rate. This could be attributed to the increased pressure due to gravity.
| Table 2: Flow rate of water samples. | ||
| Sample | Minimum Flow rate (Litre/hr) | Optimum Flow rate (Litre/hr) |
| Standard ceramic filter | 0.0225 | 1.35 |
| Treated undipped ceramic filter | 0.0250 | 1.50 |
| Treated dipped ceramic filter | 0.0283 | 1.70 |
| Mixed undipped ceramic filter | 0.0243 | 1.45 |
| Mixed dipped ceramic filter | 0.0267 | 1.60 |
| Untreated undipped ceramic filter Untreated dipped ceramic filter |
0.0233 0.0258 |
1.40 1.55 |
| Legends: Dipped: Dipped in silver nanoparticle solution Undipped: Not dipped in silver nanoparticle solution Untreated: Non-hot water treated sawdust sample Treated: Hot water-treated sawdust sample Mixed: A mixture of Hot water-treated and non-hot water-treated sawdust. |
||
The initial flow rate was observed to be much greater than other flow rates measured over subsequent hours, which could be due to the deposition of colloids as the turbid water was being filtered. It was observed that the flow rates of filters with silver Ag were slightly higher than those without the impregnation of silver, particularly the hot water-treated ones. This could be assumed to be due to the absence or reduction in the polyphenolic phytochemical substances that could form aggregates with existing heavy metals in the water and in the process form clogs that could reduce the pore sizes which in turn reduces the flowrate of the eluting water over time. In another vein, the ability of Ag ions to form chelates with the colloids possibly pulled them together and reduces their spread thus creating more room in the pores for the eluting water to pass through freely. This should account for the increase in the flow rate observed in the hot water treated and silver nanoparticle-dipped water filters. All the filters from the treated sawdust samples gave a higher flow rate as compared to the untreated ones.
A correlation has been found between clay content flow rate and pore size [26]. The mineral composition of clay might play an important role in the purification process which may pose a problem when not properly selected. To achieve the desired flow rate, the plasticity of clay [27,28] and the size of the burnout material (Hagan, et al. 2009) will influence the quality of burnout material added to achieve the flow rate.
The size might also affect the precise measure of effluents when burnout material is measured by volume because burnout materials such as sawdust can affect both the flow rate and microbiological efficacy of the filter [29]. Therefore, different mix ratios may be appropriate for use depending on burnout materials chosen for use with the quantity of the burnout material being slightly higher for an increase in the flow rate but a slight decrease in the efficiency. Size might also affect precise measuring when burnout material is measured by volume, burn-out materials can affect both the flow rate and microbiological efficacy [29]. Therefore, different mix ratios will apply depending on the burnout materials chosen for use.
pH
The pH of the raw water fell within the acceptable range for drinking water (6.5 – 8.5) according to the United State Environmental Agency (USEPA) but those of the filtered water were slightly lower than the pH of 7.0 obtained for the raw water (Table 3) but were still within the acceptable range for drinking water [30]. This could be attributed to the removal of contaminants such as metals that possibly raised the pH of water.
| Table 3: pH, turbidity, and total dissolved solids of raw water and effluents. | |||
| Filtered Water Source | pH | Turbidity (NTU) | TDS (ppm) |
| Raw water | 7.00 | 4 | 274 |
| Standard ceramic filter | 6.86 | 2 | 221 |
| Treated undipped filter | 6.80 | 1 | 214 |
| Treated dipped filter | 6.70 | 1 | 236 |
| Mixed undipped filter | 6.80 | 1 | 218 |
| Mixed dipped filter | 6.73 | 1 | 246 |
| Untreated undipped filter | 6.98 | 2 | 241 |
| Untreated dipped filter | 6.51 | 2 | 196 |
Turbidity
The clarity of the raw and filtered water as expressed as turbidity as presented in Table 3 ranged between 1 and 4 NTU. These values were lower than the expected values for drinking water which should not be greater than 5 NTU but the best should be 1 NTU [31,32]. Filters produced from the hot water-treated sawdust gave better results for those dipped and undipped in silver nanoparticles than filtrates from filters made from the untreated sawdust which were slightly higher. The relatively higher turbidity of 4 TNU detected in the raw water may be due to the high turbidity levels displayed by surface water during periods of high rainfall because it is surface water (APHA/AWWA/WEF, 2012).
Total Dissolved Solids (TDS)
The existence of high levels of Total Dissolved Solids (TDS) in drinking water may affect the taste and palatability of the water. With the standard TDS, values are set as excellent when the values range between 50 and 150, good for values ranging between 150 and 250, and fair for values between 250 and 300 while values greater than 300 ppm are considered poor and not good for drinking water (WHO). The presence of high levels of TDS may affect the taste of the drinking water. The palatability of drinking water has been related to taste as follows; when it is less than 300 mg/L it is excellent, when it is between 300 and 600 mg/L it is good, it is fair when it is between 600 mg/L to 900 mg/L, when it is between 900 mg/L and 1200 mg/L it is poor. Anything greater than 1200 mg/L is not acceptable [33,34]. All the filtered water had values much lower than 300 ppm and could be considered drinkable with the filter made from the untreated sawdust dipped in silver nanoparticles giving the best result of 196 ppm. (Ref). The filters proved to substantially improve the quality of water treated because it has the ability to reduce TDS and improve pH and turbidity concentration, in the treated water sample. Water-containing contaminants, both biological and chemical, whose concentrations are above the permissible levels are usually of great concern to human and animal health.
Selected heavy metal content
Chemical contaminants such as Manganese (Mn), Zinc (Zn), Cadmium (Cd), and Lead (Pb) were studied [35-37]. The results presented in Table 4 showed that there was no detectable amount of lead in the raw water so it was not suitable for use in determining the amount of lead in the filtrate. Detectable amounts of Manganese were found in the raw water sample and most of the effluents from the filters gave lower concentrations of the manganese except for three filters that were dipped in silver nanoparticles. Mn is present in clay as magnesia and the majority of it is encapsulated in a clay matrix with a tiny percentage of particles exposed on the body surface. Therefore, the presence of Mn in the effluents could be attributed to the possibility of the displacement of manganese from the clay filter resulting from leaching even though the concentration of manganese in the effluents from these three filters (Table 4) was still less than the prescribed standards of the World Health Organization of 0.02 mg/L [31].
| Table 4: Determined heavy metals in raw and filtered water. | ||||
| Filtrate Source | Metal Concentration (mg/L) | |||
| Pb | Mn | Zn | Cd | |
| Raw Water | -0.184 | 0.046 | -0.0170 | 0.024 |
| Standard Ceramic Filter | -0.058 | 0.040 | 0.0012 | 0.021 |
| Treated Undipped Ceramic Filter | -0.128 | 0,043 | 0.0041 | 0.022 |
| Treated Dipped Ceramic Filter | -0.149 | 0.096 | 0.0041 | 0.027 |
| Mixed Undipped Ceramic Filter | -0.050 | 0.027 | 0.0035 | 0.033 |
| Mixed Dipped Ceramic Filter | -0.126 | 0.071 | 0.0059 | 0.031 |
| Untreated Undipped Ceramic Filter | -0.042 | 0.035 | 0.0046 | 0.032 |
| Untreated dipped Ceramic Filter | -0.028 | 0.065 | 0.0071 | 0.036 |
| Legends: Dipped: Dipped in Ag nanoparticle solution Undipped: Not dipped in Ag nanoparticle solution Untreated: Non-hot water treated sawdust sample Treated: Hot water-treated sawdust sample Mixed: A mixture of Hot water-treated and non-hot water-treated sawdust. |
||||
Zinc was not detectable in the raw water but was found in the effluents even though the concentrations detected were lower than the minimum standards of 3.00 mg/L stipulated by the World Health Organization. The silver nanoparticle dipped filters gave relatively higher values than the undipped and the obtained values were still very much below the prescribed standard for drinking water. Clay is known to contain Zn as one of its essential metals of which Ca, Fe, and K complete the series while As and Pb are the major toxic metals [38] this could be the possible source of Zn in the filtered water.
Though some of the Cd levels found in some of the filtered water were higher than the concentration detected in the raw water, the values obtained were lower still lower than the WHO standards for drinking water [39]. This can be attributed to the ability of Cd to get adsorbed on the surface of clay but the degree of metal sorption to clay is usually impacted by the solution pH and ionic strength. Metals, other than Cd can also get accumulated through flocculation of water which usually leads to metal accumulation in marginal marine settings. These metals can be desorbed when transitioning between fresh water and seawater pH and ionic strength conditions [40]. Clay minerals as a source of cadmium to estuaries. The increase in ionic strength has a greater impact than an increase in the pH. The higher concentrations of metals obtained in the silver nanoparticle dipped filters may be due to the displacement of these metals from the ceramic filters by the Ag due to their lower activity as compared to silver as expressed in the activity series.
Though the metal concentrations obtained for the effluents were lower than those of the standards for drinking water [41]., it might be necessary to subject the filters to desorption with solutions of the appropriate pH and ionic strength to rid them of the excessive constituent metals that may affect the efficiency of the ceramic filters [40] present in them. Naturally, the clay of which the filter is composed determines which elements are present in the effluents [41,42].
These metals can be desorbed when transitioning between fresh water and seawater pH and ionic strength conditions [40]. Economically, the components of clay and burnout materials are both readily available, and ceramic filters have the ability to remove particulates, turbidity, and Total Dissolved Solids (TDS). In developing countries, household-scale ceramic filters are being used as a better treatment option for both unpurified and insufficiently disinfected water at the household level [43-45]. It was generally observed that the water sample contain relatively low trace metals.
This study concludes that contaminants were reduced from the raw water sample. The different ceramic water filters produced were all effective in the purification of colloidal water by reducing the turbidity, lowering the total dissolved solids, and improving the pH value. The materials used in the production are locally available and some are waste products, through the production process, the environment is made clean. The filters produced with hot water-treated sawdust (treated sample) proved to be more effective in the treatment of water compared to other samples produced (mixture and untreated samples). It is also important to soak the ceramic filters in water before use to enhance the siphoning effect and the removal of metals, though in very minute quantities, existing in clays.
- Ngure FM, Humphrey JH, Mbuya MN, Majo F, Mutasa K, Govha M, Mazarura E, Chasekwa B, Prendergast AJ, Curtis V, Boor KJ, Stoltzfus RJ. Formative research on hygiene behaviors and geophagy among infants and young children and implications of exposure to fecal bacteria. Am J Trop Med Hyg. 2013 Oct;89(4):709-16. doi: 10.4269/ajtmh.12-0568. Epub 2013 Sep 3. PMID: 24002485; PMCID: PMC3795101.
- Bolton M. Rural Water Filter, in Good Design - Energy Systems, Chicago, Massachusetts Institute of Technology, Cambridge. Master of Engineering Thesis. 2009.
- Bain R, Cronk R, Hossain R, Bonjour S, Onda K, Wright J, Yang H, Slaymaker T, Hunter P, Prüss-Ustün A, Bartram J. Global assessment of exposure to faecal contamination through drinking water based on a systematic review. Trop Med Int Health. 2014 Aug;19(8):917-27. doi: 10.1111/tmi.12334. Epub 2014 May 8. PMID: 24811893; PMCID: PMC4255778.
- Schmidt WP, Cairncross S. Household water treatment in poor populations: is there enough evidence for scaling up now? Environ Sci Technol. 2009 Feb 15;43(4):986-92. doi: 10.1021/es802232w. PMID: 19320147.
- Luby SP, Halder AK, Huda TM, Unicomb L, Islam MS, Arnold BF, Johnston RB. Microbiological Contamination of Drinking Water Associated with Subsequent Child Diarrhea. Am J Trop Med Hyg. 2015 Nov;93(5):904-911. doi: 10.4269/ajtmh.15-0274. Epub 2015 Oct 5. PMID: 26438031; PMCID: PMC4703288.
- Preidis GA, Hill C, Guerrant RL, Ramakrishna BS, Tannock GW, Versalovic J. Probiotics, enteric and diarrheal diseases, and global health. Gastroenterology. 2011 Jan;140(1):8-14. doi: 10.1053/j.gastro.2010.11.010. Epub 2010 Nov 12. PMID: 21075108; PMCID: PMC3417817.
- Khan JR, Hossain MB, Chakraborty PA, Mistry SK. Household drinking water E. coli contamination and its associated risk with childhood diarrhea in Bangladesh. Environ Sci Pollut Res Int. 2022 May;29(21):32180-32189. doi: 10.1007/s11356-021-18460-9. Epub 2022 Jan 11. PMID: 35015232.
- Pruss-Ustun A, Bos B, Bartram J. Safer Water, Better Health: Costs, benefits, and sustainability of interventions to protect and promote health, World Health Organization, Geneva. 2008.
- Kobayashi Y, Ito Y, Shrestha S, Yokomichi H, Nishida K. Relationship between diarrhoea risk and the combinations of drinking water sources in the Kathmandu Valley, Nepal. Int Health. 2022 Mar 2;14(2):195-200. doi: 10.1093/inthealth/ihab032. PMID: 34115863; PMCID: PMC8890808.
- Clasen TF, Brown J, Collin SM. Preventing diarrhoea with household ceramic water filters: assessment of a pilot project in Bolivia. Int J Environ Health Res. 2006 Jun;16(3):231-9. doi: 10.1080/09603120600641474. PMID: 16611567.
- Ogunyoku TA, Nover DM, McKenzie ER, Joshi G, Fleenor WE. Point-Of-Use Drinking Water Treatment in the Developing World: Acceptance, Project Monitoring and Revision. International Journal for Service Learning in Engineering. 2011; 6(1):14-32.
- Bielefeldt AR, Kowalski K, Summers RS. Bacterial treatment effectiveness of point-of-use ceramic water filters. Water Res. 2009 Aug;43(14):3559-65. doi: 10.1016/j.watres.2009.04.047. Epub 2009 May 13. PMID: 19500815.
- Dies WR. Development of a ceramic water filter for Nepal. Master Thesis. MIT Department of Civil and Environmental Engineering. Cambridge, MA, USA. 2003.
- Donachy B. Manual/Guide for Health Trainers and Others Involved in the Monitoring of the Colloidal Silver Ceramic Water Filter. 2004.
- Clasen T, Nadakatti S, Menon S. Microbiological performance of a water treatment unit designed for household use in developing countries. Trop Med Int Health. 2006 Sep;11(9):1399-405. doi: 10.1111/j.1365-3156.2006.01699.x. PMID: 16930262.
- Hassan A, Achakzai P, Nangyal H. Detection and Estimation of Alkaloids, Saponins, and Tannins in Herbs of Quetta Baluchistan. American-Eurasian Journal of Agricultural & Environmental Science. 2015; 15(6):985-990.
- Shoppee CW. Chemistry of Steroids, 2nd Edition, Butterworths, London. 1964.
- Wall ME, Eddy CR, McClenna ML, Klump ME. Detection and estimation of steroid sapogenins in plant tissue, Anal Chem. 1952; 24:1337.
- Farnsworth NR. Biological and phytochemical screening of plants. J Pharm Sci. 1966 Mar;55(3):225-76. doi: 10.1002/jps.2600550302. PMID: 5335471.
- Evans WC. Treace and Evans. Pharmacognosy, 15th Edition. W.R. Saunders, London. 2002.
- Chellam SJ, Jacangelo G, Boacquisti TP, Long BW. Effects of Operating Conditions and Pretreatment for Nanofiltration of Surface Water. AWWA Membrane Technology Conference, New Orleans. 1997.
- Plappally AK, Soboyejo A, Fausey N, Soboyejo W, Brown L, Stochastic Modeling of Filtrate Alkalinity in Water Filtration Devices: Transport through Micro/Nano Porous Clay Based Ceramic Materials. Journal of Natural and Environmental Sciences. 2010.; 1(2):96-105.
- Sandermann W, Preusser HJ. The Effect of Wood Extractives on the Setting of Cement-bonded Wood Materials. Holzforschung. 1960; 14:3; 70–77.
- Moslemi AA, Lim YT. Compatibility of Southern Heartwood with Portland Cement. Forest Product Journal. 1984; 34: 7/8; 22-26.
- Plappally AK, Yakub I, Brown LC, Soboyejo WO, Soboyejo ABO. Theoretical and Experimental Investigation of Water Flow through Porous Ceramic Clay Composite Water Filter. Fluids Dynamics and Materials Processing. 2009; 5(4):373-398.
- Oyanedel-Craver VA, Smith JA. Sustainable colloidal-silver-impregnated ceramic filter for point-of-use water treatment. Environ Sci Technol. 2008 Feb 1;42(3):927-33. doi: 10.1021/es071268u. PMID: 18323124.
- Andrade FA, Al-Qureshi HA, Hotza D. Measuring the Plasticity of Clays: A Review. Applied Clay Science. 2011; 51(1-2):1-7.
- Zaccaron A, Nandi VS, Bernardin AM. Fast Drying for the Manufacture of Clay Ceramics using Natural Clays. Journal of Building Engineering. 2021; 33:101877-101884.
- Lantagne D, Klarman M, Mayer A, Preston K, Napotnik J, Jellison K. Effect of production variables on microbiological removal in locally-produced ceramic filters for household water treatment. Int J Environ Health Res. 2010 Jun;20(3):171-87. doi: 10.1080/09603120903440665. PMID: 20162486.
- Yehia HMA, Said SM. Drinking Water Treatment: pH Adjustment using Natural Physical Field. Journal of Bioscience and Medicines. 2021; 9(6):55-66.
- World Health Organization (WHO). Drinking Water Standard: Guidelines for drinking water quality were set up in Geneva in 1993 and updated in 2006. 2006.
- World Health Organization (WHO). Guideline for drinking water quality. 2011. http://www.who.int/guidelines/en.
- Chen S, Xie J, Wen Z. Microalgae-based wastewater treatment and utilization of microalgae biomass. Advances in Bioenergy. 2021; 6(1):165-198.
- Nadersha S, Hassan AA. Biodesalination and Treatment of Raw Hypersaline Produced Water Samples using Indigenous Wastewater Algal Consortia. Desalination. 2022; 528(5):115838-115852.
- Wolowiec M, Komorowska-Kaufman M, Pruss A, Rzepa G, Badja T. Removal of Heavy Metals and Metalloids from Water Using Drinking Water Treatment Residuals as Adsorbents: A Review. Minerals. 2019; 9(8):487-495.
- Khatri N, Tyagi S, Rawtani D. Recent strategies for the removal of iron from water: A review. Journal of Water Process Engineering. 2017; 19:291–304.
- Gude JCJ, Rietveld LC, van Halem D. As(III) oxidation by MnO2 during groundwater treatment. Water Res. 2017 Mar 15;111:41-51. doi: 10.1016/j.watres.2016.12.041. Epub 2016 Dec 26. PMID: 28040540.
- Nkansah MA, Korankye M, Darko G, Dodd M. Heavy metal content and potential health risk of geophagic white clay from the Kumasi Metropolis in Ghana. Toxicol Rep. 2016 Aug 21;3:644-651. doi: 10.1016/j.toxrep.2016.08.005. PMID: 28959588; PMCID: PMC5616015.
- WHO/UNICEF. Joint Monitoring Programme for Water Supply and Sanitation: 2012 update-UNICEF and World Health Organization; New York. 2012.
- Hao W, Kashiwabara T, Jin R, Takahashi Y, Gingras M, Alessi DS, Konhauser KO. Clay minerals as a source of cadmium to estuaries. Sci Rep. 2020 Jun 26;10(1):10417. doi: 10.1038/s41598-020-67279-w. PMID: 32591616; PMCID: PMC7320025.
- Bora AJ, Dutta RK. Removal of Metals (Pb, Cd, Cu, Cr, Ni, and Co) from Drinking Water by Oxidation-Coagulation-Absorption at Optimized pH. Journal of Water Process Engineering. 2019; 31:100839-100851.
- Halem DV, Van der Laan H, Heijman SGJ, Van Dijk JC, Amy GL. Assessing the Sustainability of the Silver-impregnated Ceramic Pot Filter for Low-cost Household Drinking Water Treatment. Physics and Chemistry of the Earth. 2009; 34(1-2):36-42.
- Lantagne DS. Investigation of the Potters for Peace colloidal silver impregnated ceramic filter: Report 1: Intrinsic effectiveness. Boston: Alethia Environmental, Boston, MA, USA. 2001.
- Clasen T, Naranjo J, Frauchiger D, Gerba C. Laboratory assessment of a gravity-fed ultrafiltration water treatment device designed for household use in low-income settings. Am J Trop Med Hyg. 2009 May;80(5):819-23. PMID: 19407130.
- Tsozue D, Nzeugang AN, Mache JR, Loweh S, Fagel N. Mineralogical Physico-chemical and Technological Characterisation of Clays from Maroua for Use in Ceramic Bricks Production. Journal of Building Engineering. 2017; 11:17-24.